IQI
Individualized Quantitative trait loci (QTL) Index
Software / IQI v1.0 (Java)
Introduction
IQI v1.0 (Java) has the following main functions.
1、Calculate the degree (IQI) of regulation between SNP and the quantitative trait for each single sample.
2、Perform the standard hypothesis testing method - DQ analysis framework, to accurately detect the QTL regulation differences in disease state.
Note: The two functions are implemented by one command line.
Pre-installation
IQI v1.0 (Java) is implemented by Java. Before using it, please install Java programing environment (Java 8 or update) first.
Download
IQI v1.0 (Java, Command-line running) or from GitHub ( https://github.com/onethird-lab/IQI/)
Usage
command-line example:
parameters:
-input.pheno_1: Input the phenotype information of the case group;
-input.pheno_0: Input the phenotype information of the control group;
-input.geno_0: Input the SNP genotype data of the case group;
-input.geno_1: Input the SNP genotype data of the control group;
-output.IQI_0: Specify the file name of the IQI values of the SNP-phenotype pairs of all samples in the control group;
-output.IQI_1: Specify the file name of the IQI values of the SNP-phenotype pairs of all samples in the case group;
-output.eQe_test: Specify the file name of the results of DQ test.
Input trait file
please see trait_1.txt and trait_0.txt for more information
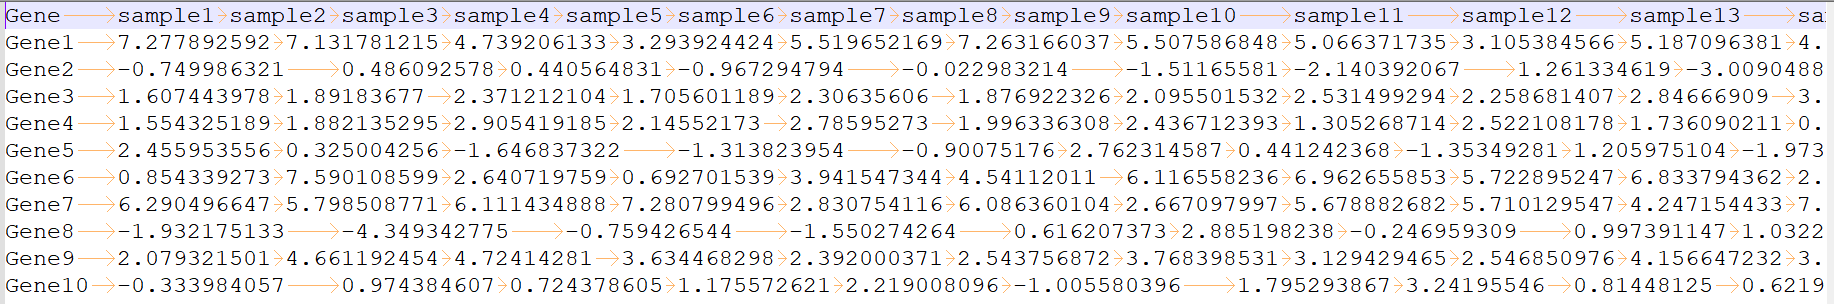
column 1: (e.g. Gene1) is the ID or name of a trait.
column 2 to the last: (e.g. 7.277892592) is the trait information of each sample.
Input trait file
please see trait_1.txt and trait_0.txt for more information
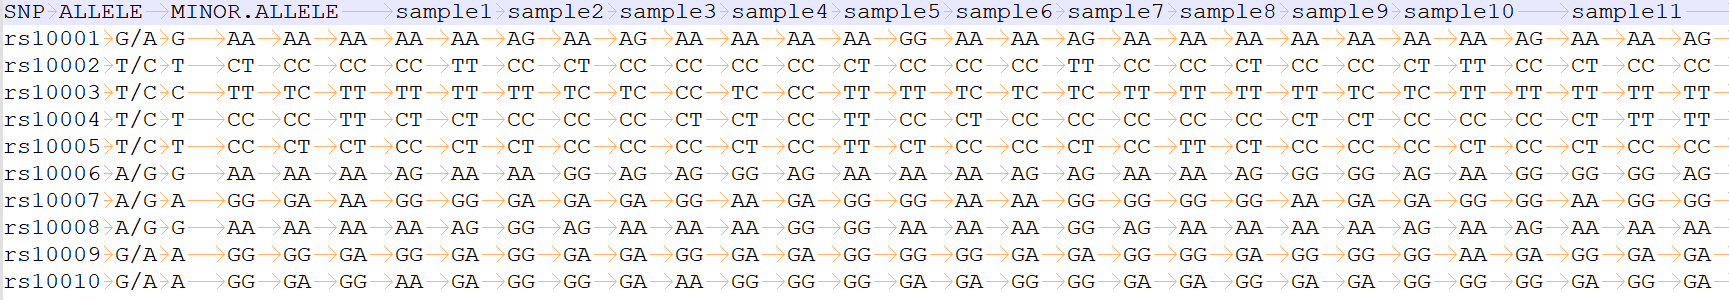
column 1: (e.g. rs10001) is the name of an SNP.
column 2: (e.g. G/A) is the two alleles.
column 3: (e.g. G) is the minor allele.
column 4 to the last: (e.g. AA) is the trait of each sample.
Output IQI file
please see IQI_1.txt and IQI_0.txt for more information
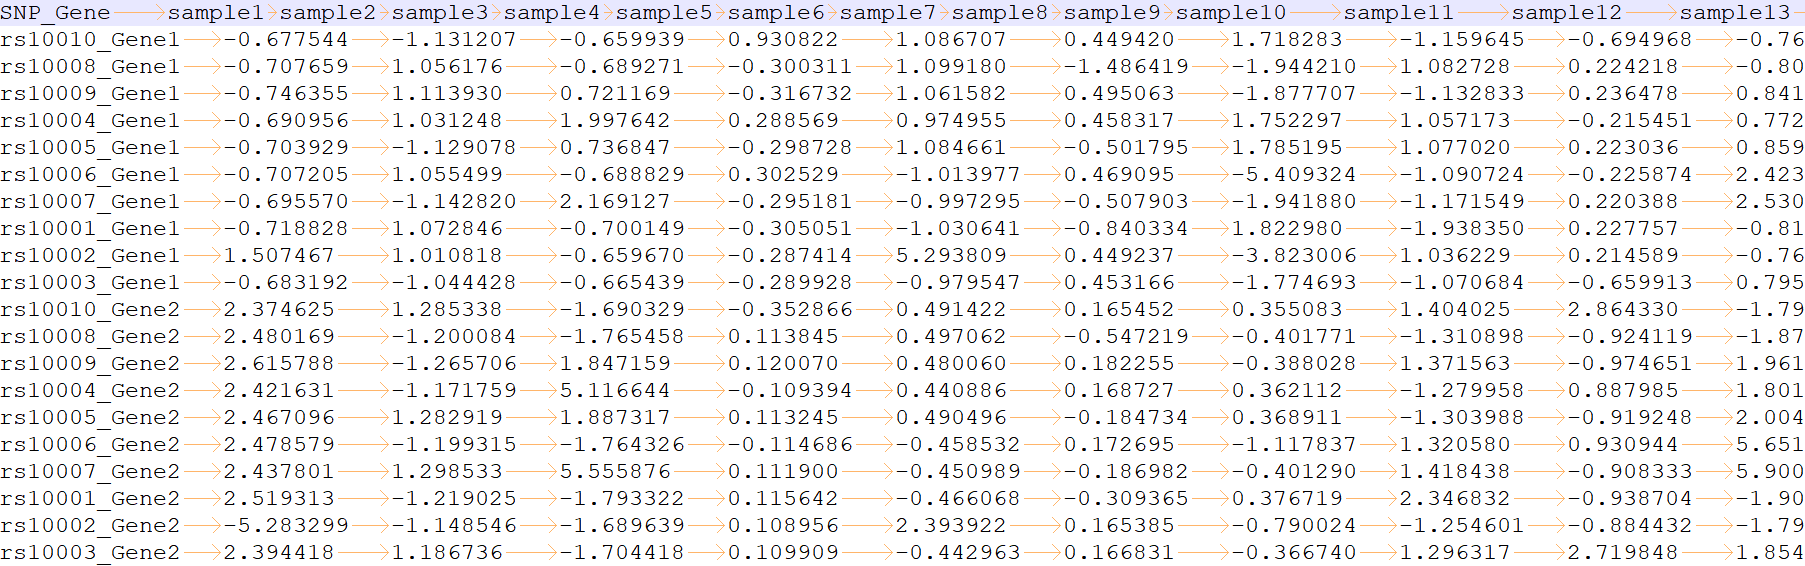
column 1: (e.g. rs10010_Gene1) is the name of the SNP-trait pair.
column 2 to the last: (e.g. -0.677544) is IQI of each sample.
DQ analysis results
please see DQ_analysis_result.txt for more information
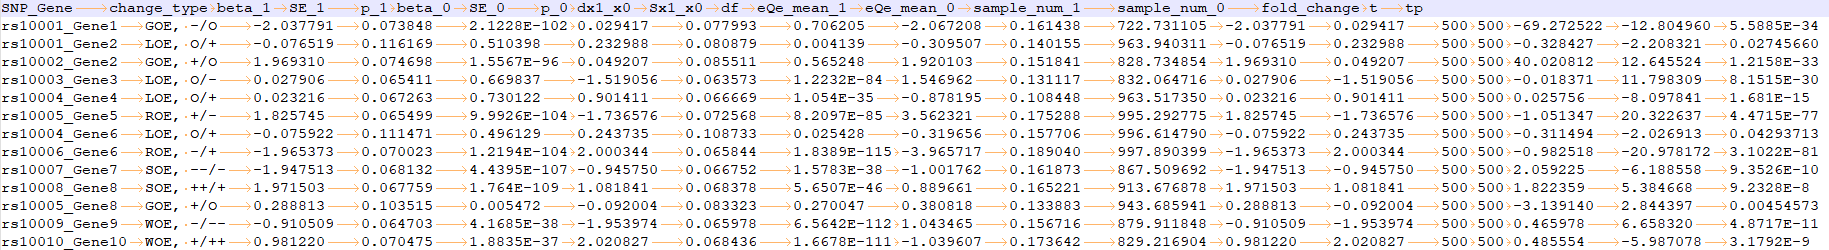
It contains 18 columns:
change_type -> change type of QTL regulation;
beta_1 -> the traditional regression based QTL analysis results of the case group;
SE_1 -> the standard error in the case group;
p_1 -> the p value in the case group;
beta_0 -> the traditional regression based QTL analysis results of the control group;
SE_0 -> the standard error in the control group;
p_0 -> the p value in the control group;
dx1_x0 -> the mean difference between case and control groups;
Sx1_x0 -> the standard error between case and control groups;
df -> the degree of freedom;
eQe_mean_1 -> the average IQI in the case group;
eQe_mean_0 -> the average IQI in the control group;
sample_num_1 -> the sample size of the case group;
sample_num_0 -> the sample size of the control group;
fold_change -> the fold change value;
t -> the DQ statistics;
tp -> the p value.
The simulated data and results were offered to test: Download