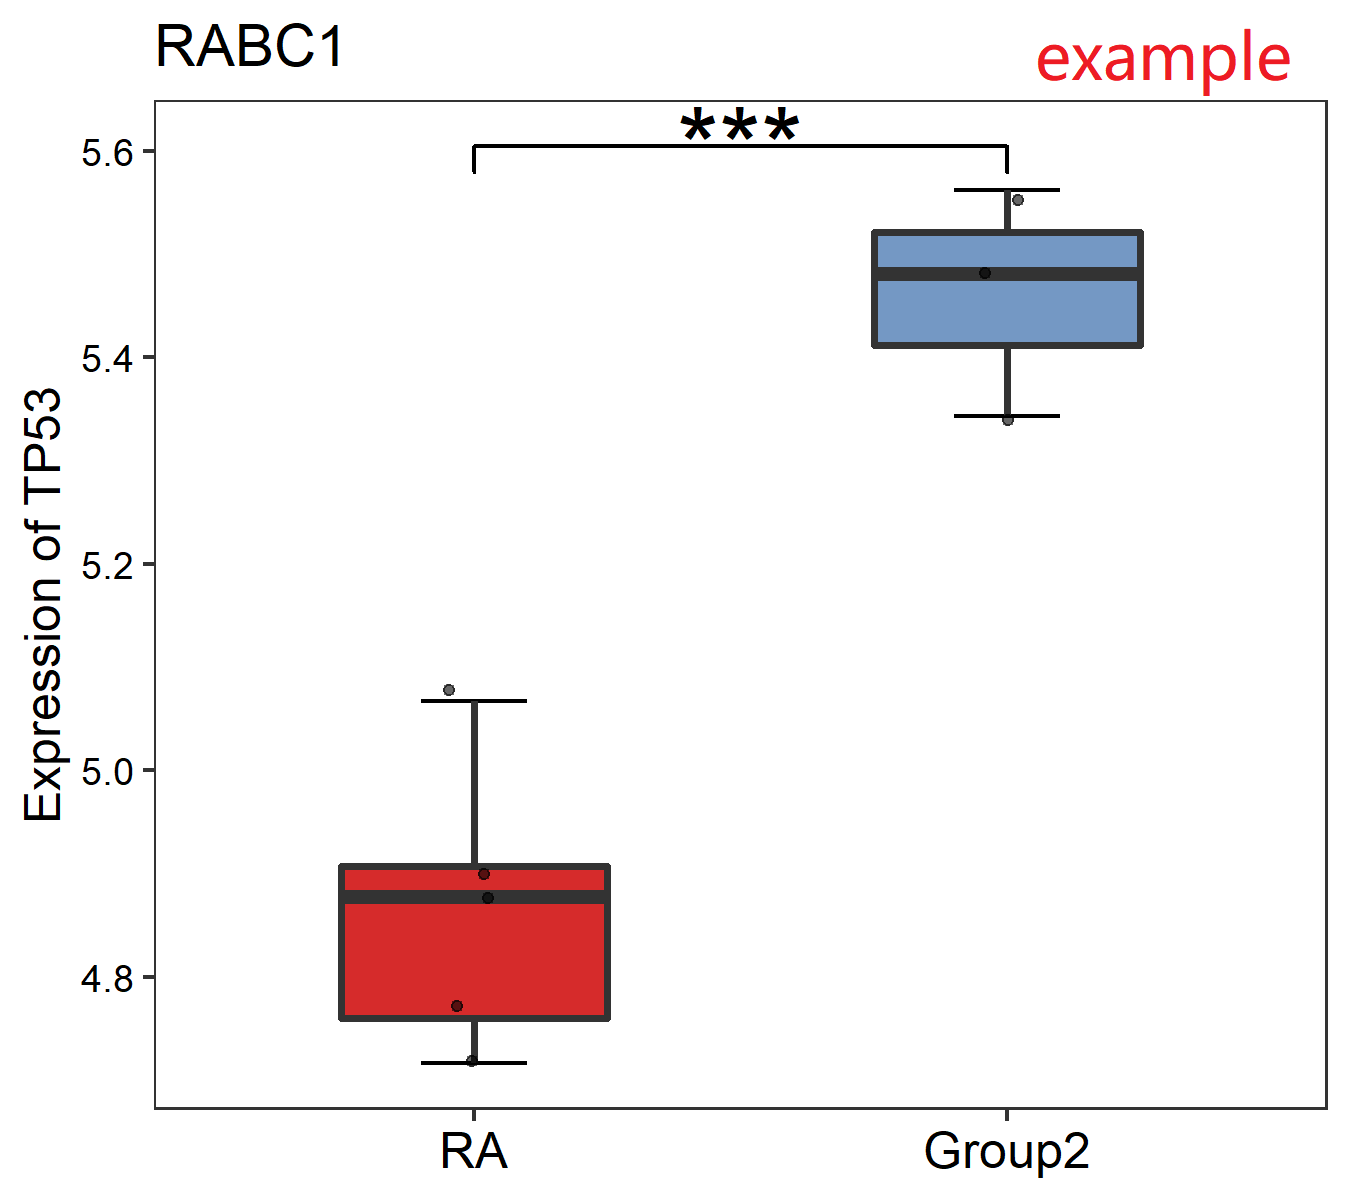
Step 1: Choose a dataset.Such as: RABC1
Step 2: Input gene name. Such as:TP53
Step 3: Choose a statistical test method. Such as:t.test
Click Submit
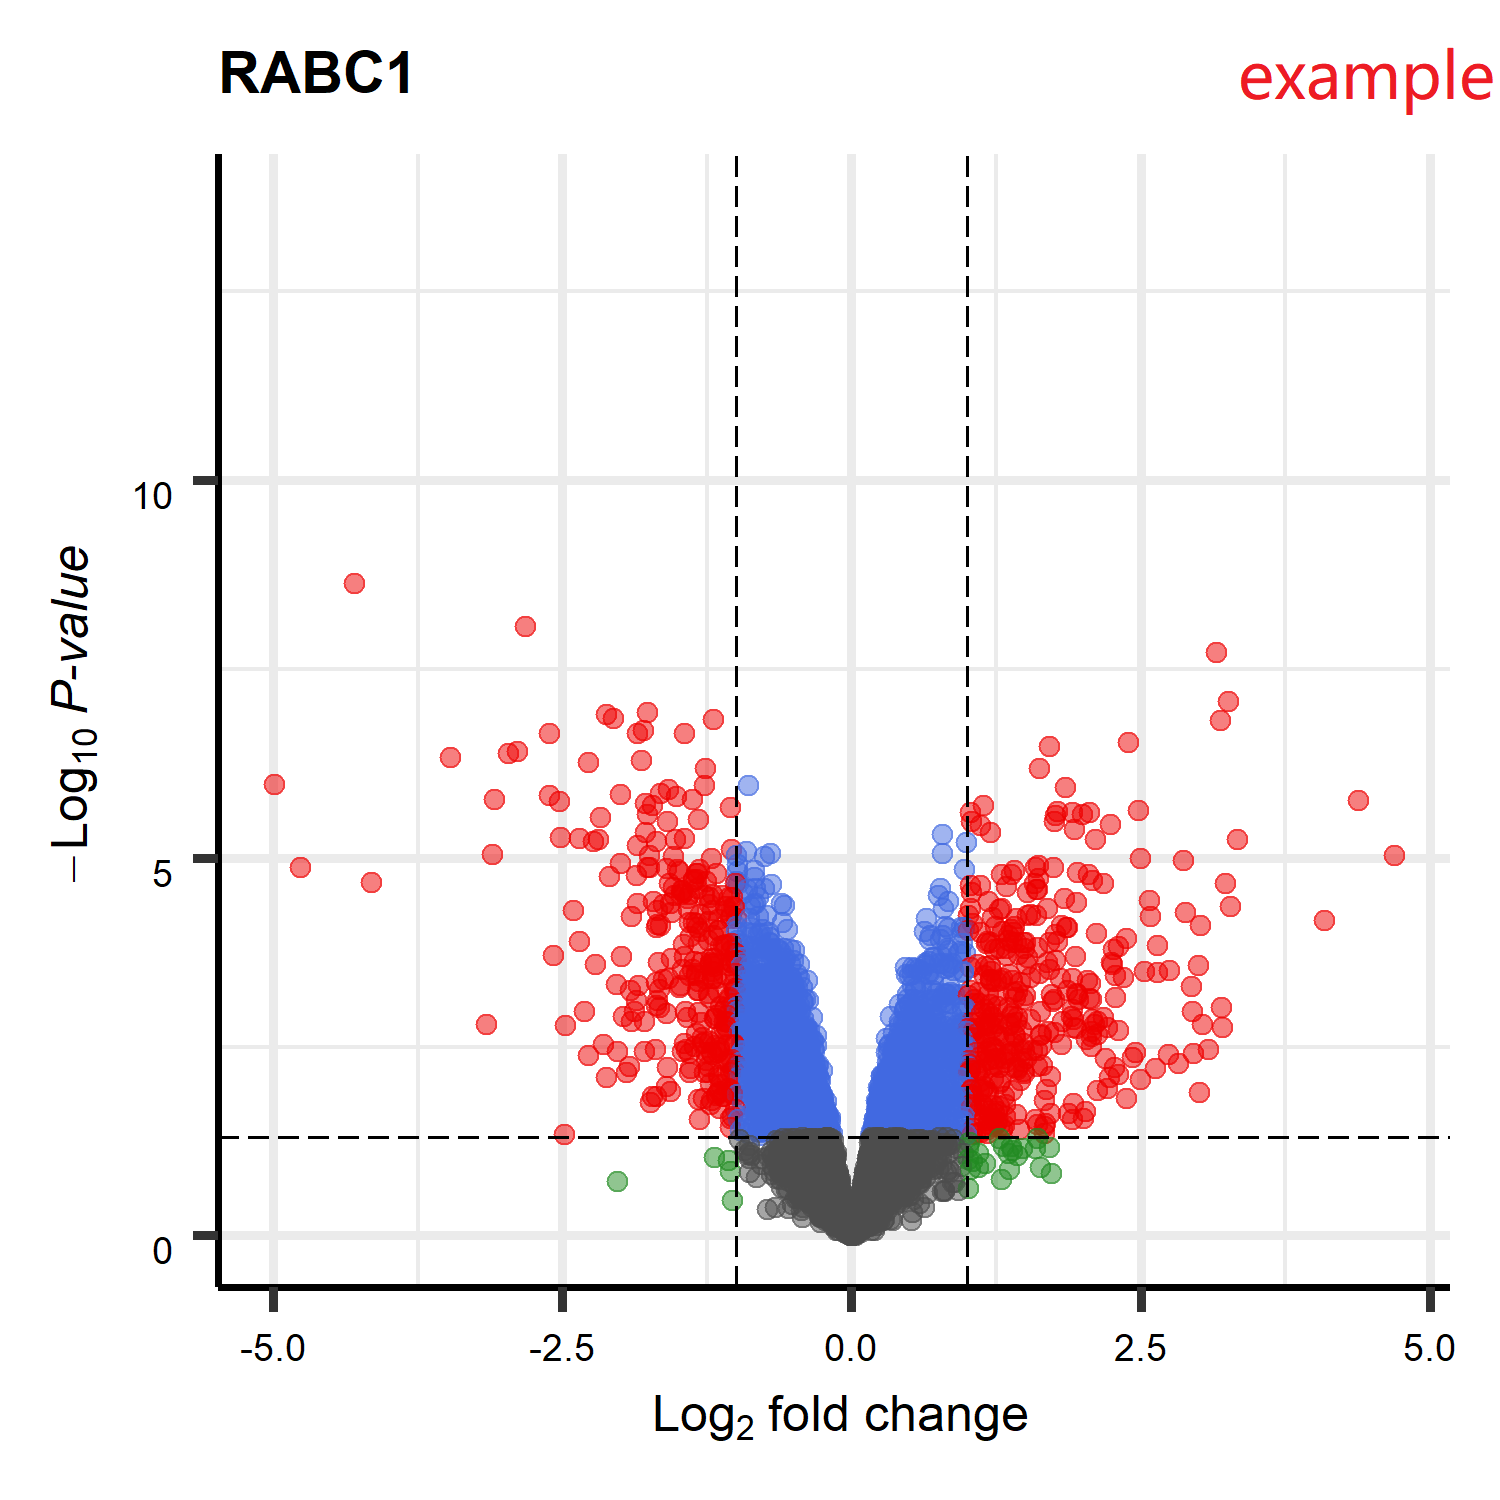
Step 2: Choose the adjusted p-value as the condition?Such as: FALSE
Step 3: Enter the p-value threshold.Such as:0.05
Step 4: Enter the logFC threshold.Such as:1
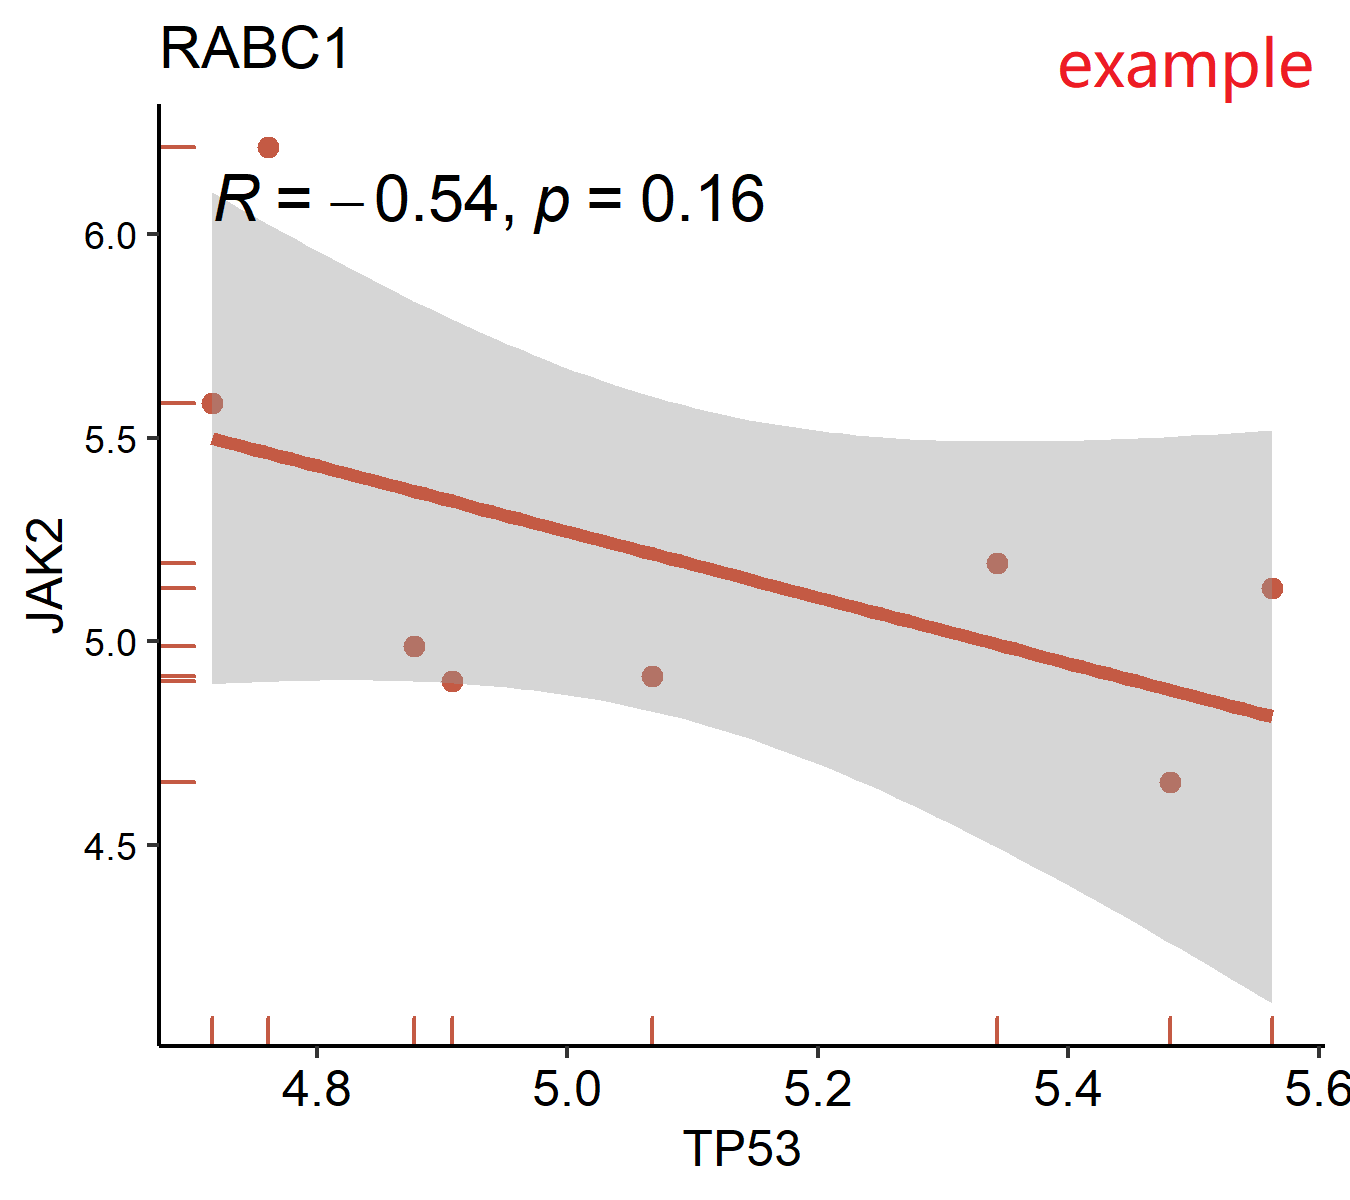
Step 2: Input the first gene name.Such as: TP53
Step 3: Input the second gene name.Such as: JAK2
Step 4: Choose a method.Such as: pearson
Step 5: Whether to add normal samples? Such as: False
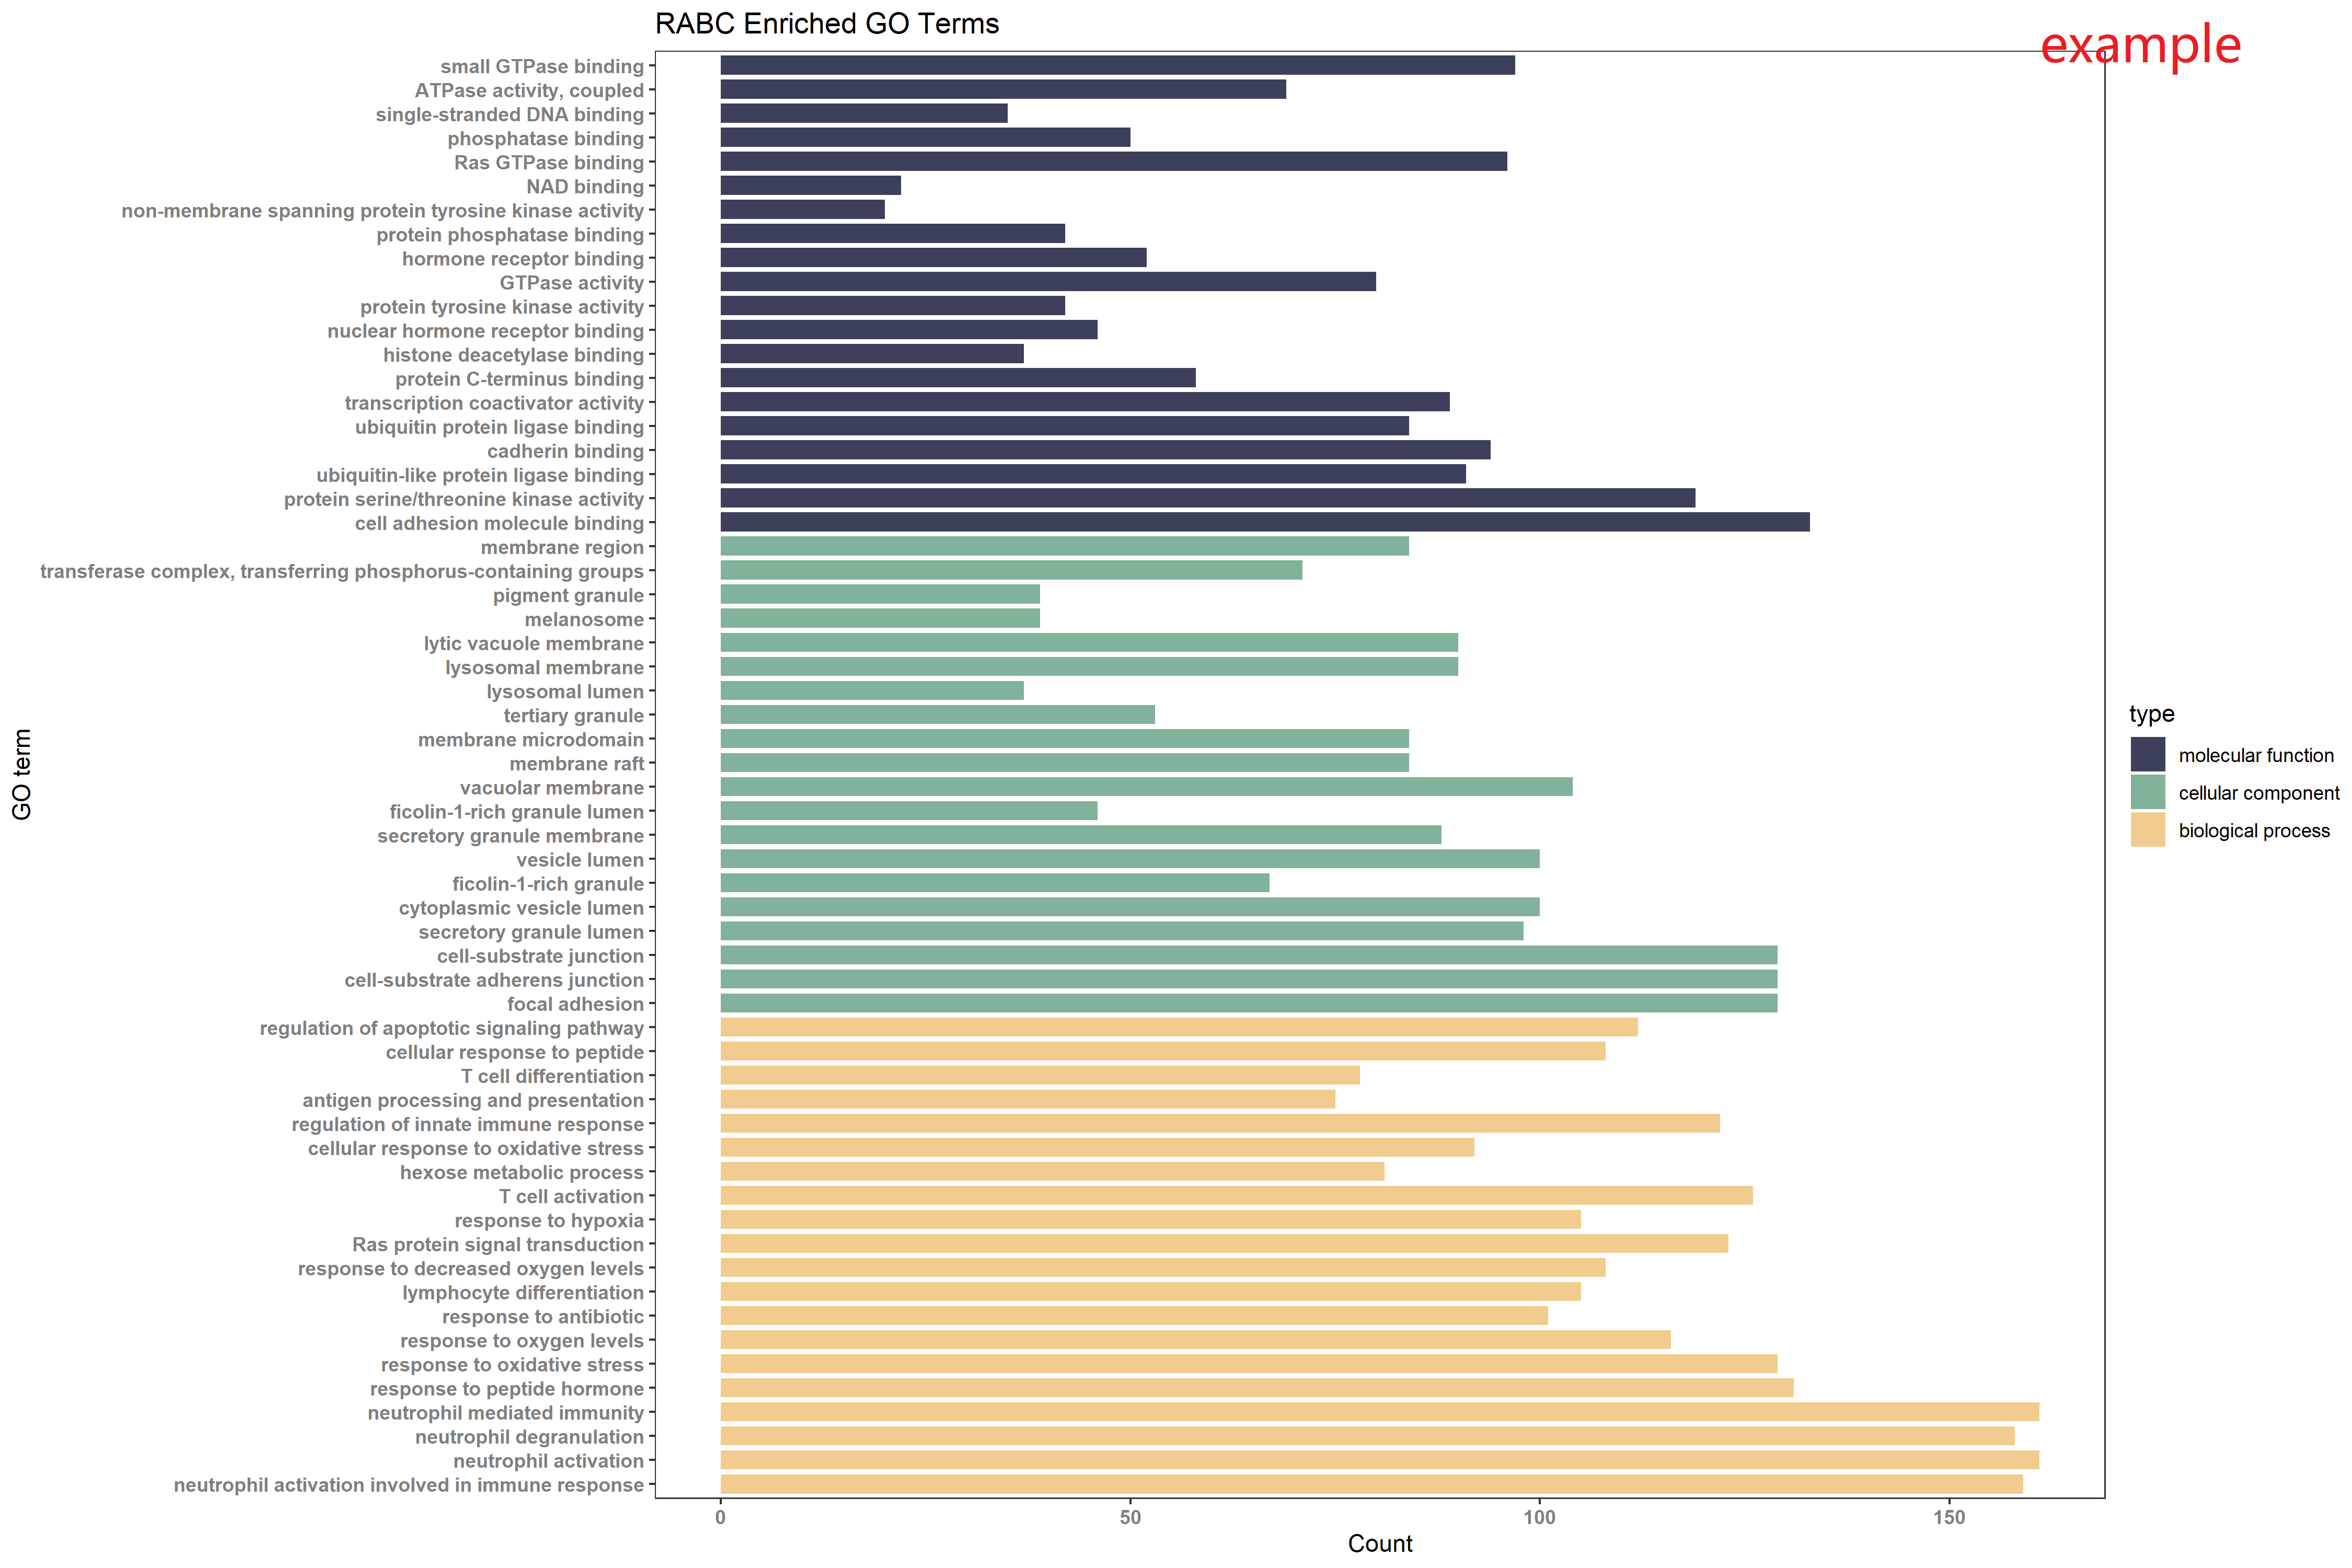
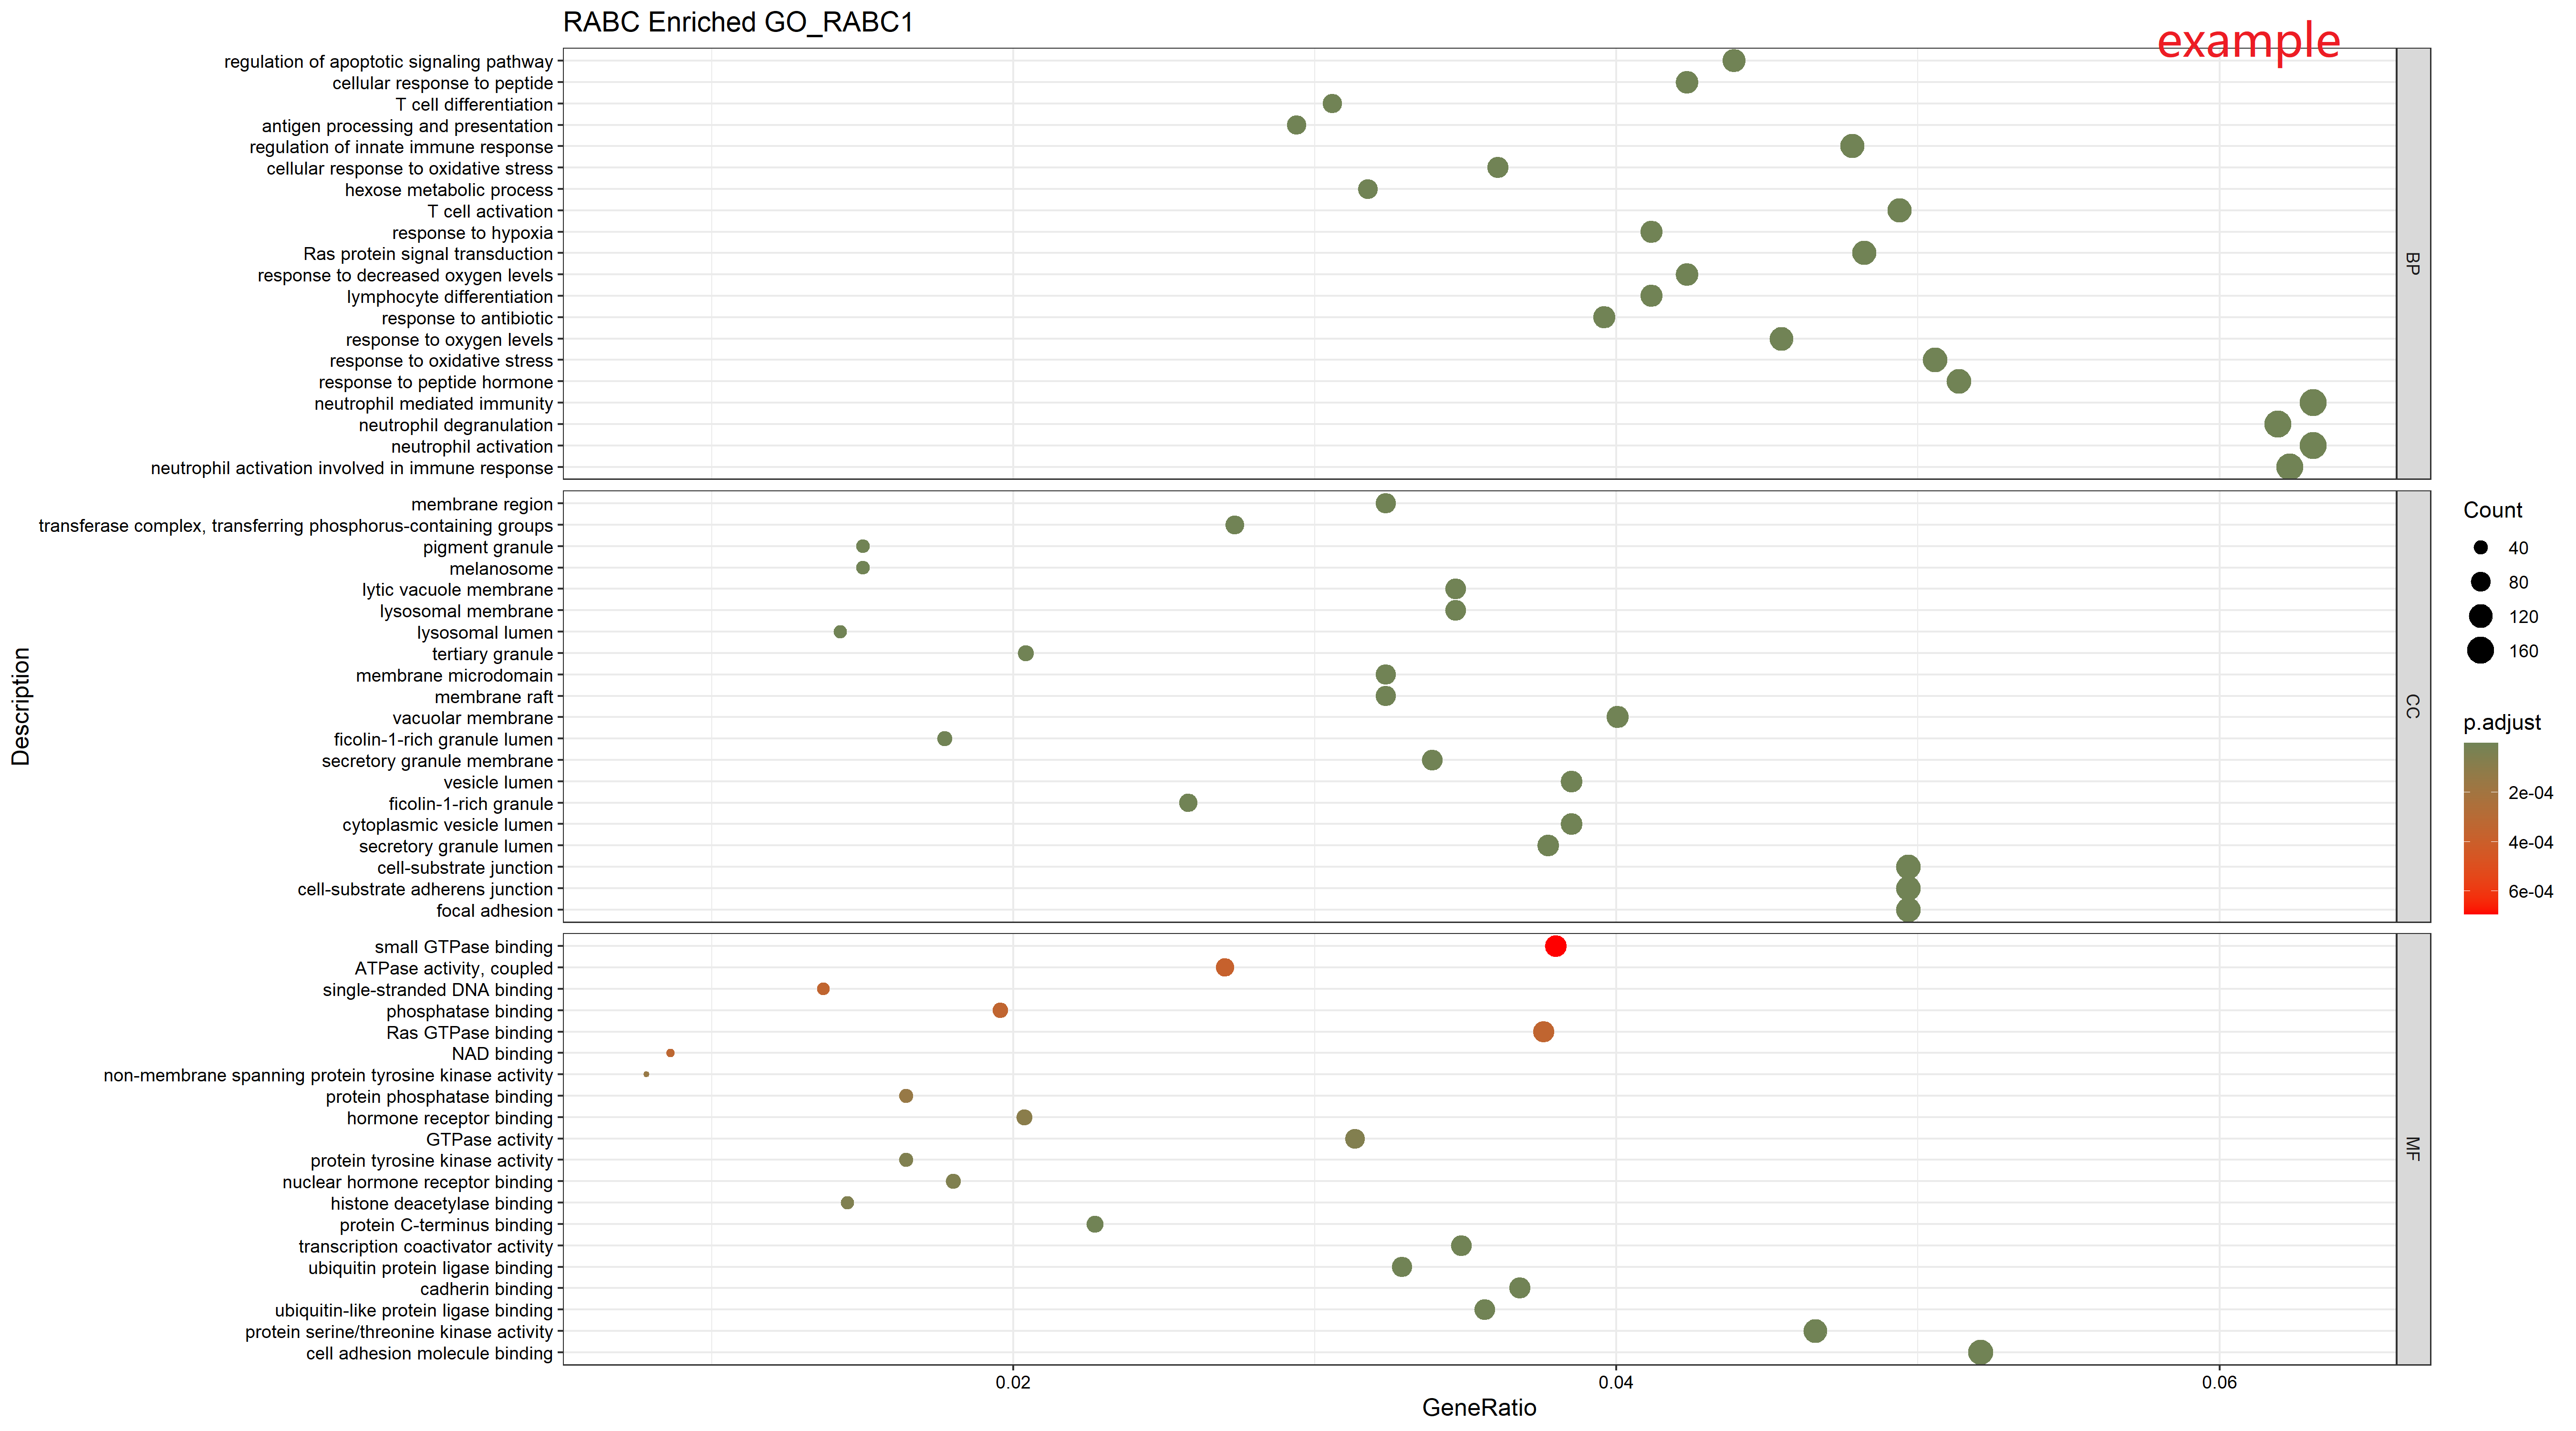
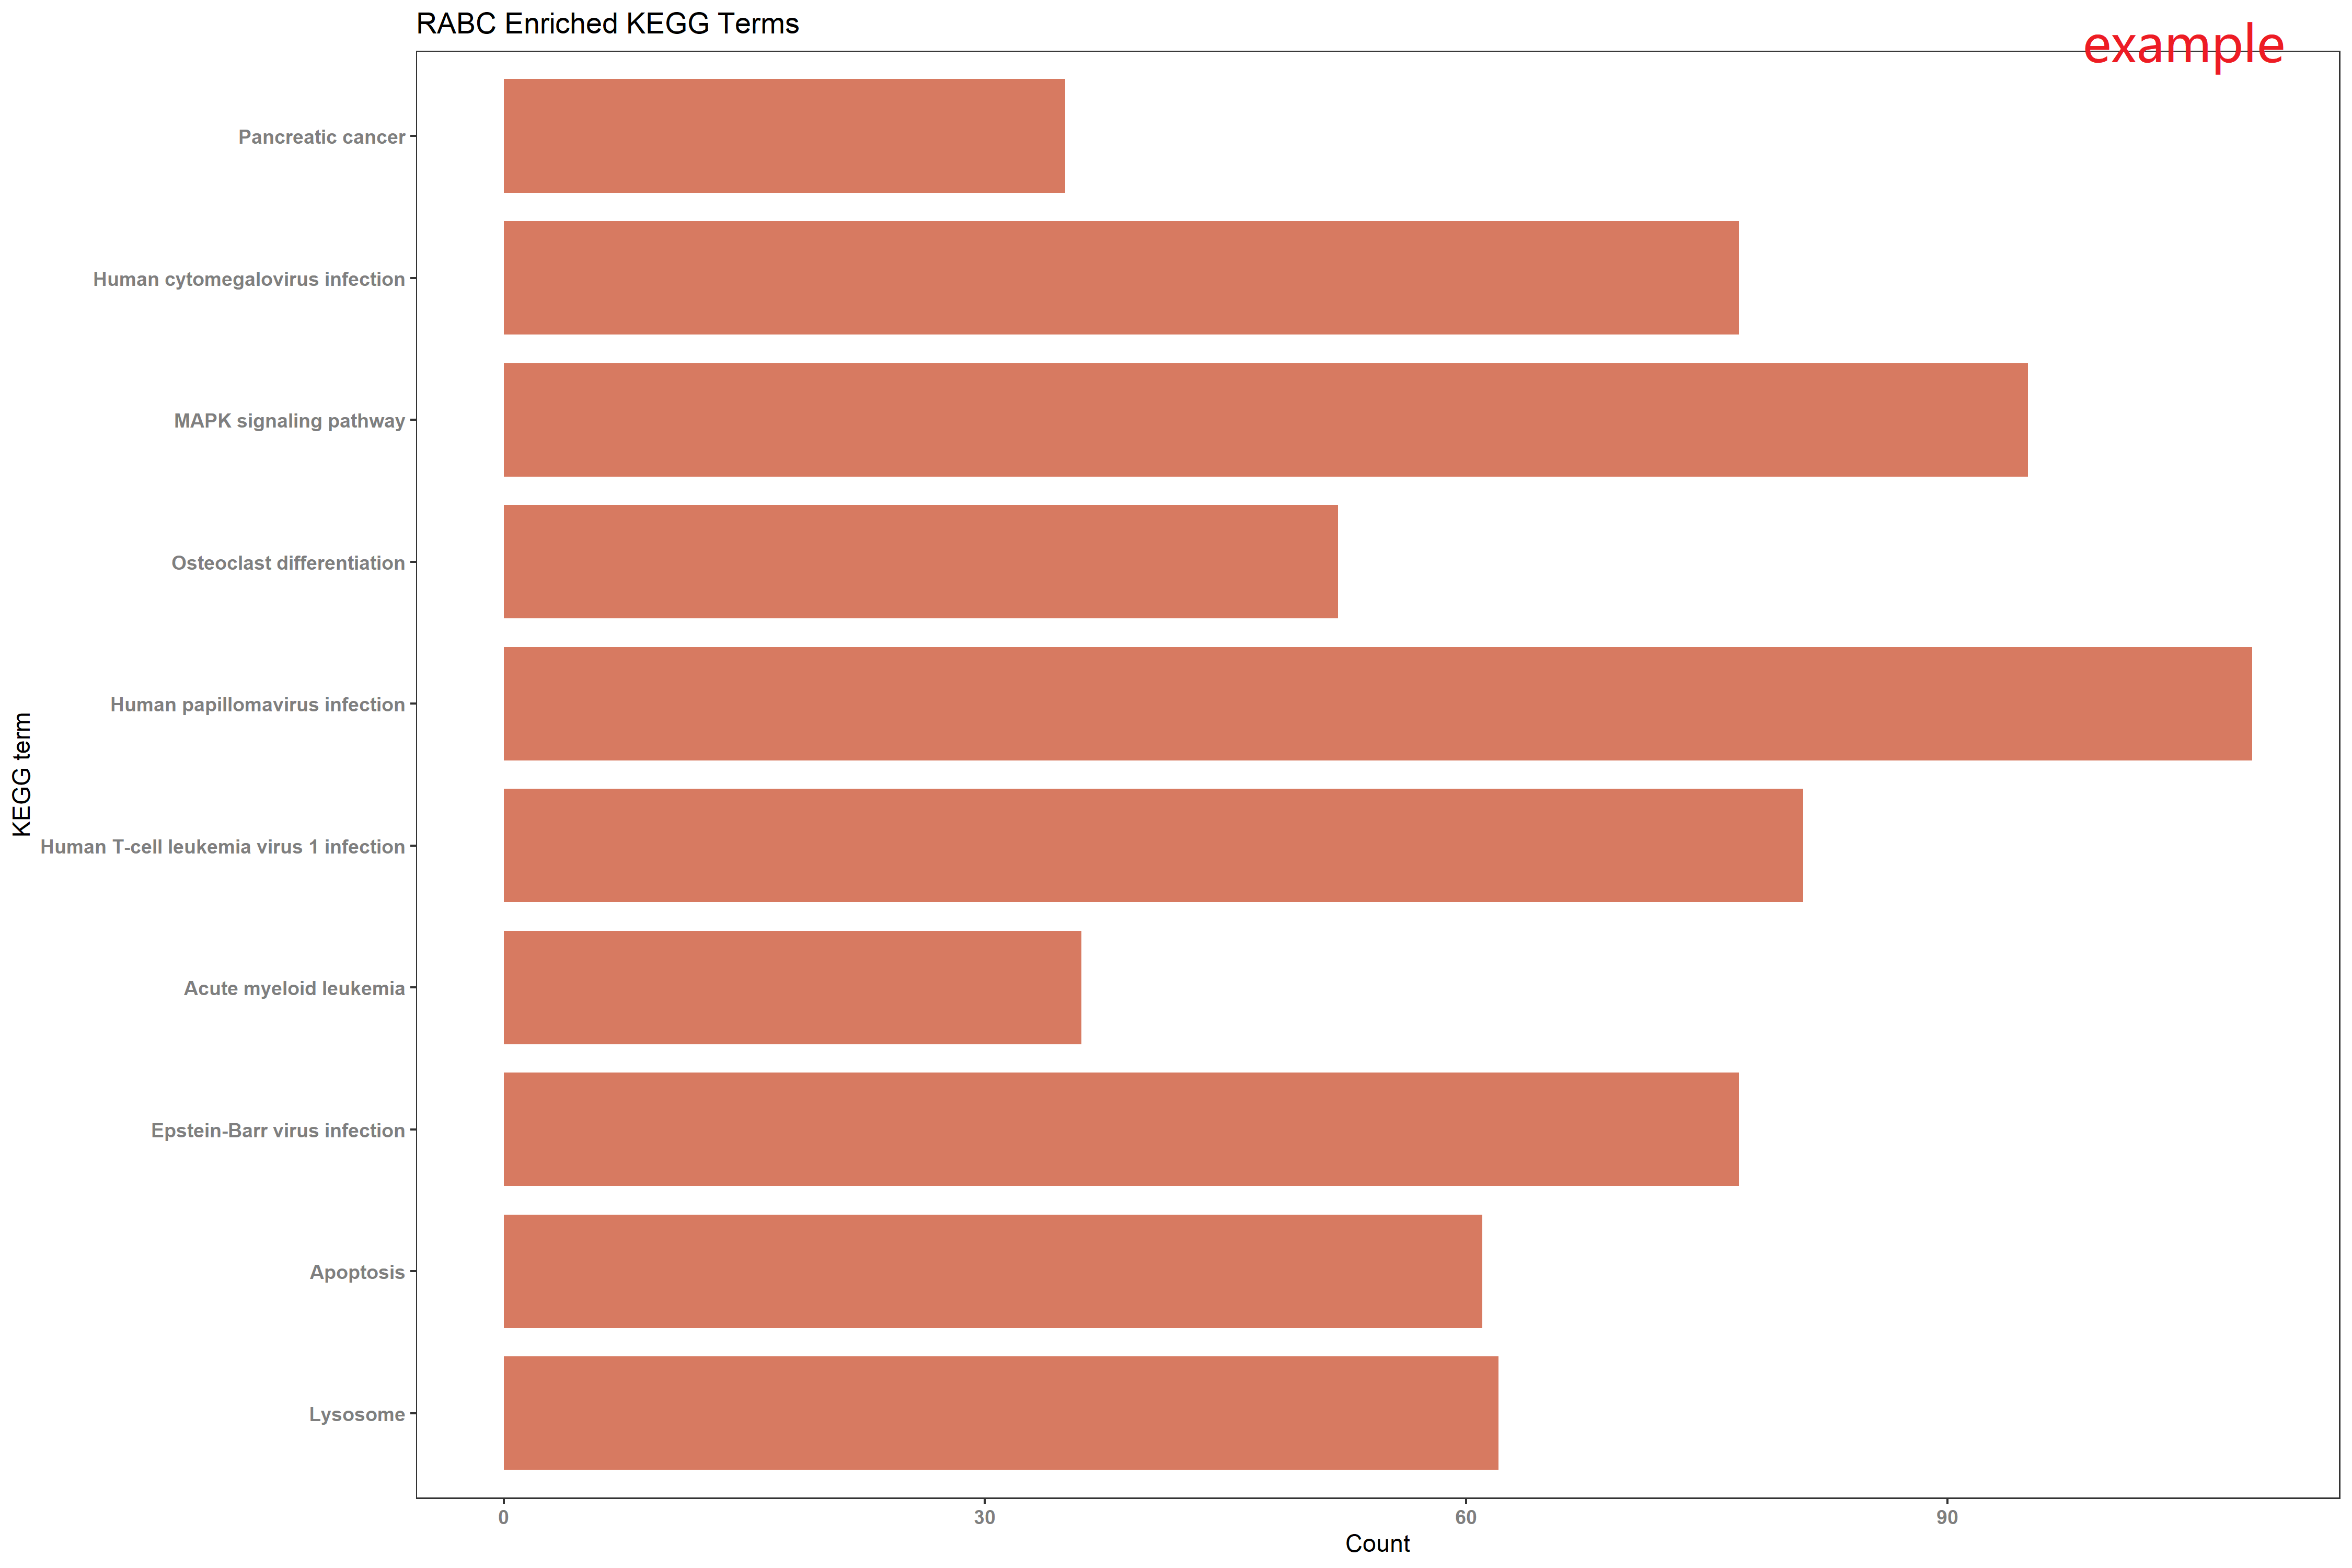
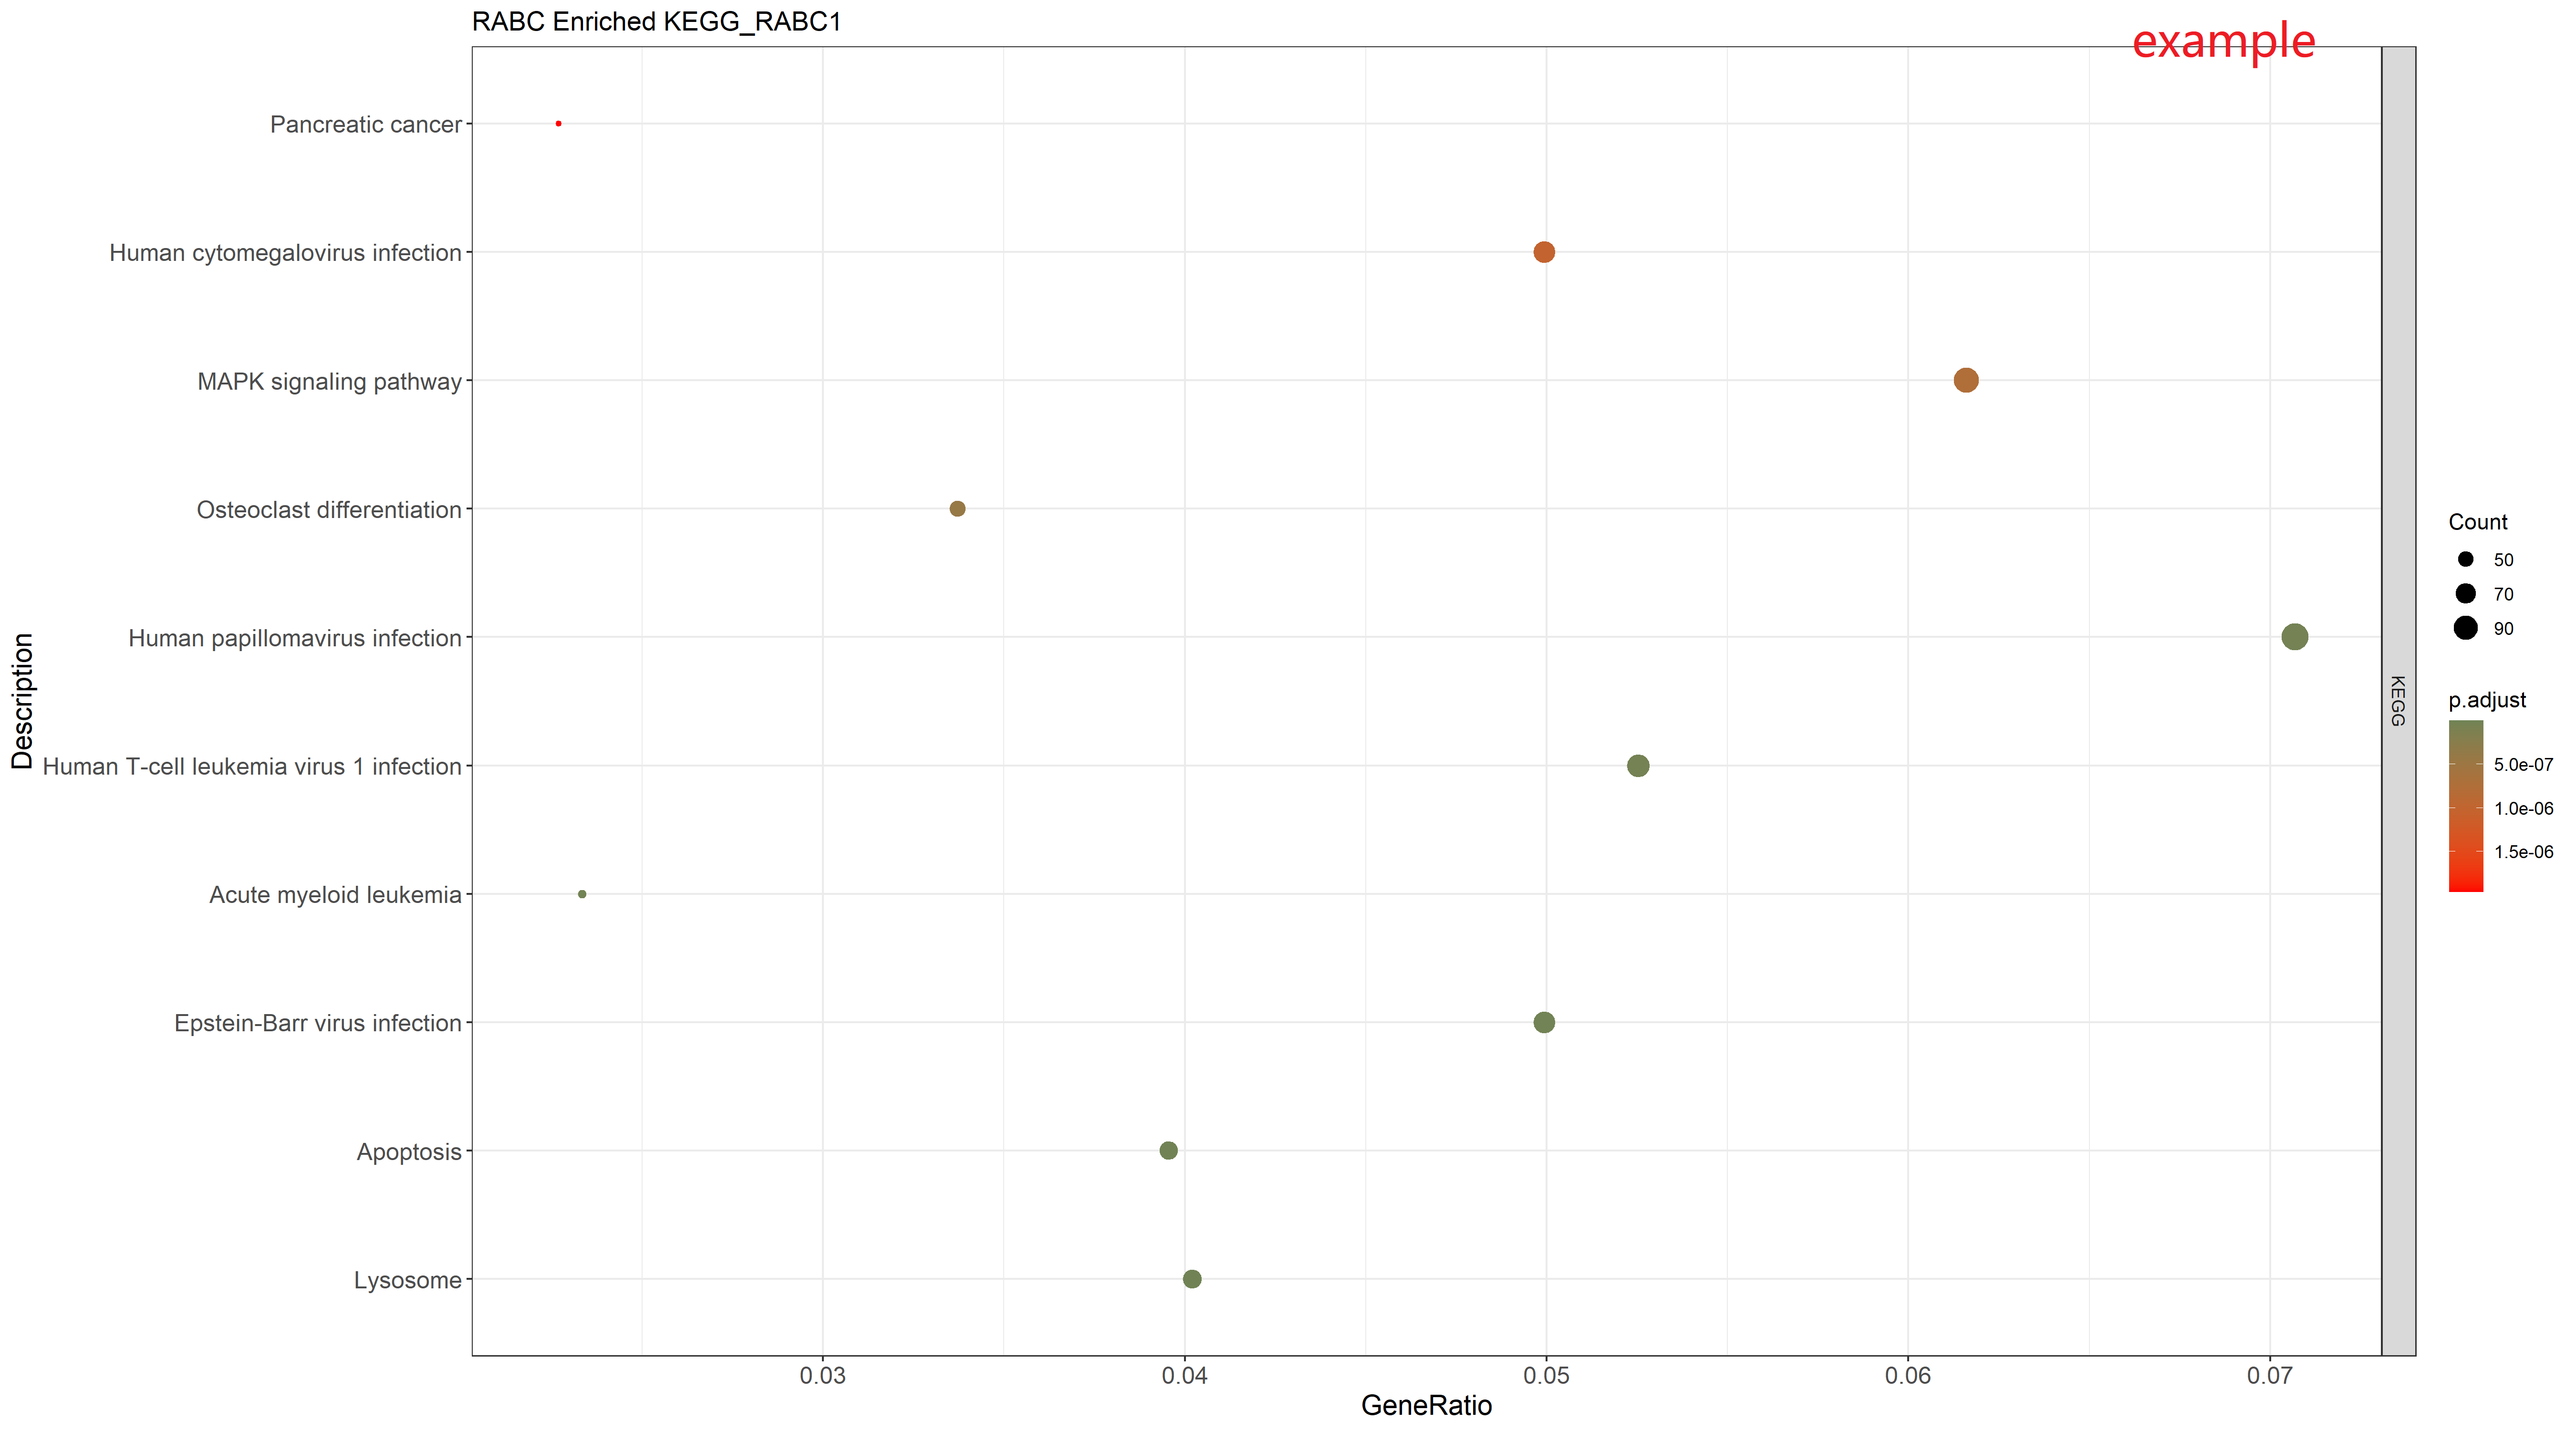
Step 3: Input the p-value threshold.Such as:0.05
Step 4: Input the number of GO-term to display. Such as:10
Step 4: Input the number of pathway to display. Such as:10