Overview
Welcome
Welcome to the Rheumatoid Arthritis Big data Center (RABC).
RABC is the first multi-omics big data resource platform for RA. There are 4 categories of data in RABC: i) multi-omics data; 2) analysis results; 3) prior knowledge; and 4) literatures.
RABC provides a user-friendly interface for browsing, searching, and downloading these data. In addition, a visualization module based on transcriptomic data also supports users to generate graphs of analysis results by inputting personalized parameters.
Data categories
Multi-omics data
- There are 140 (81.4%) datasets for transcriptomics, 22 (12.79%) datasets for epigenomics, 8 (4.65%) case-control GWAS summary statistics datasets for genome, and 2 (1.16%) datasets for proteomics.
Analysis results
- The standardized preprocessed multi-omics data were analyzed to obtain 175,209 DEGs, 105 DEMs, 18,464 DMGs, 1,764 KEGG pathways, 30,491 GO terms, 74,334 risk SNPs, 242,779 eQTLs from 49 tissues, 105 m6A-SNPs, and 18,491,669 meta-mQTLs.
Prior knowledge
- 887 SNPs, 170 microRNAs, 31 lncRNAs, 32,271 genes, 2,528 DNA methylation genes, and 9 circRNAs were obtained from 10 databases, including PedAM, Circ2Disease, MiRNASNP-v3, HMDD, LncRNADisease, PHGKB, DisGeNet, CTD, LncRNADisease v2.0, and DiseaseMeth 2.0.
Literature
- 127,073 publications in PubMed from 1972 to March 2022 were extracted.
Module
Browse
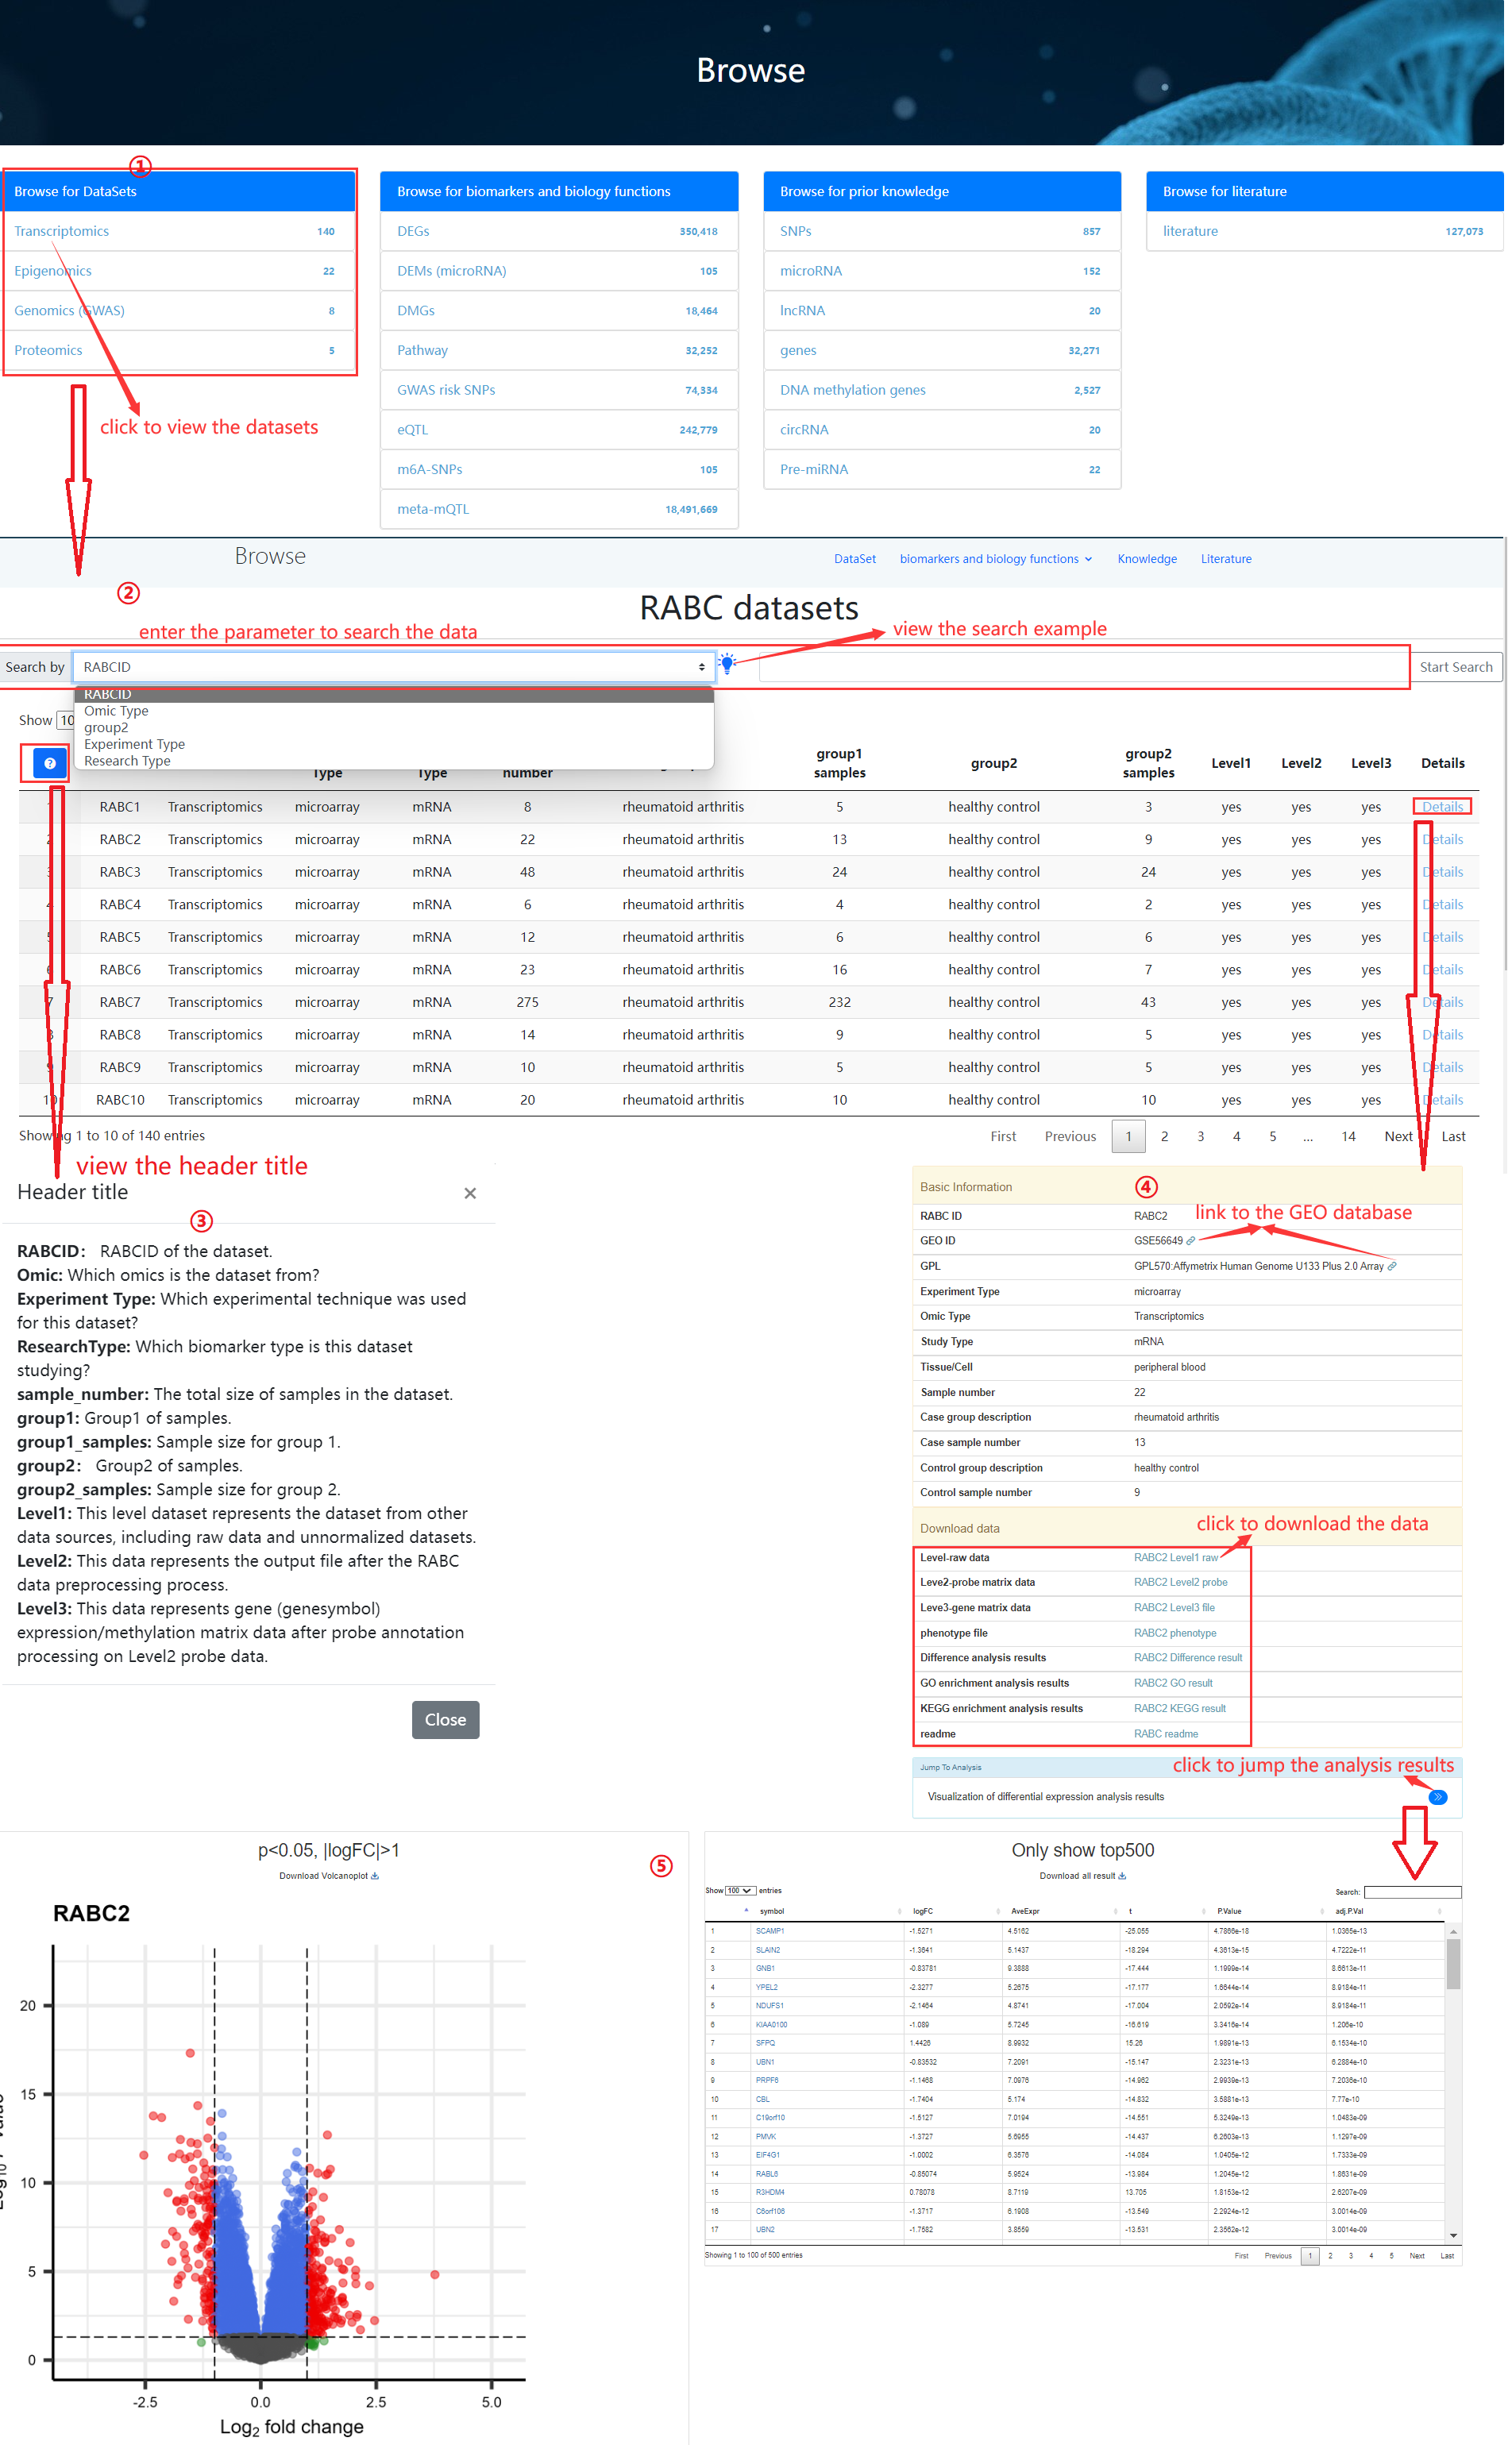
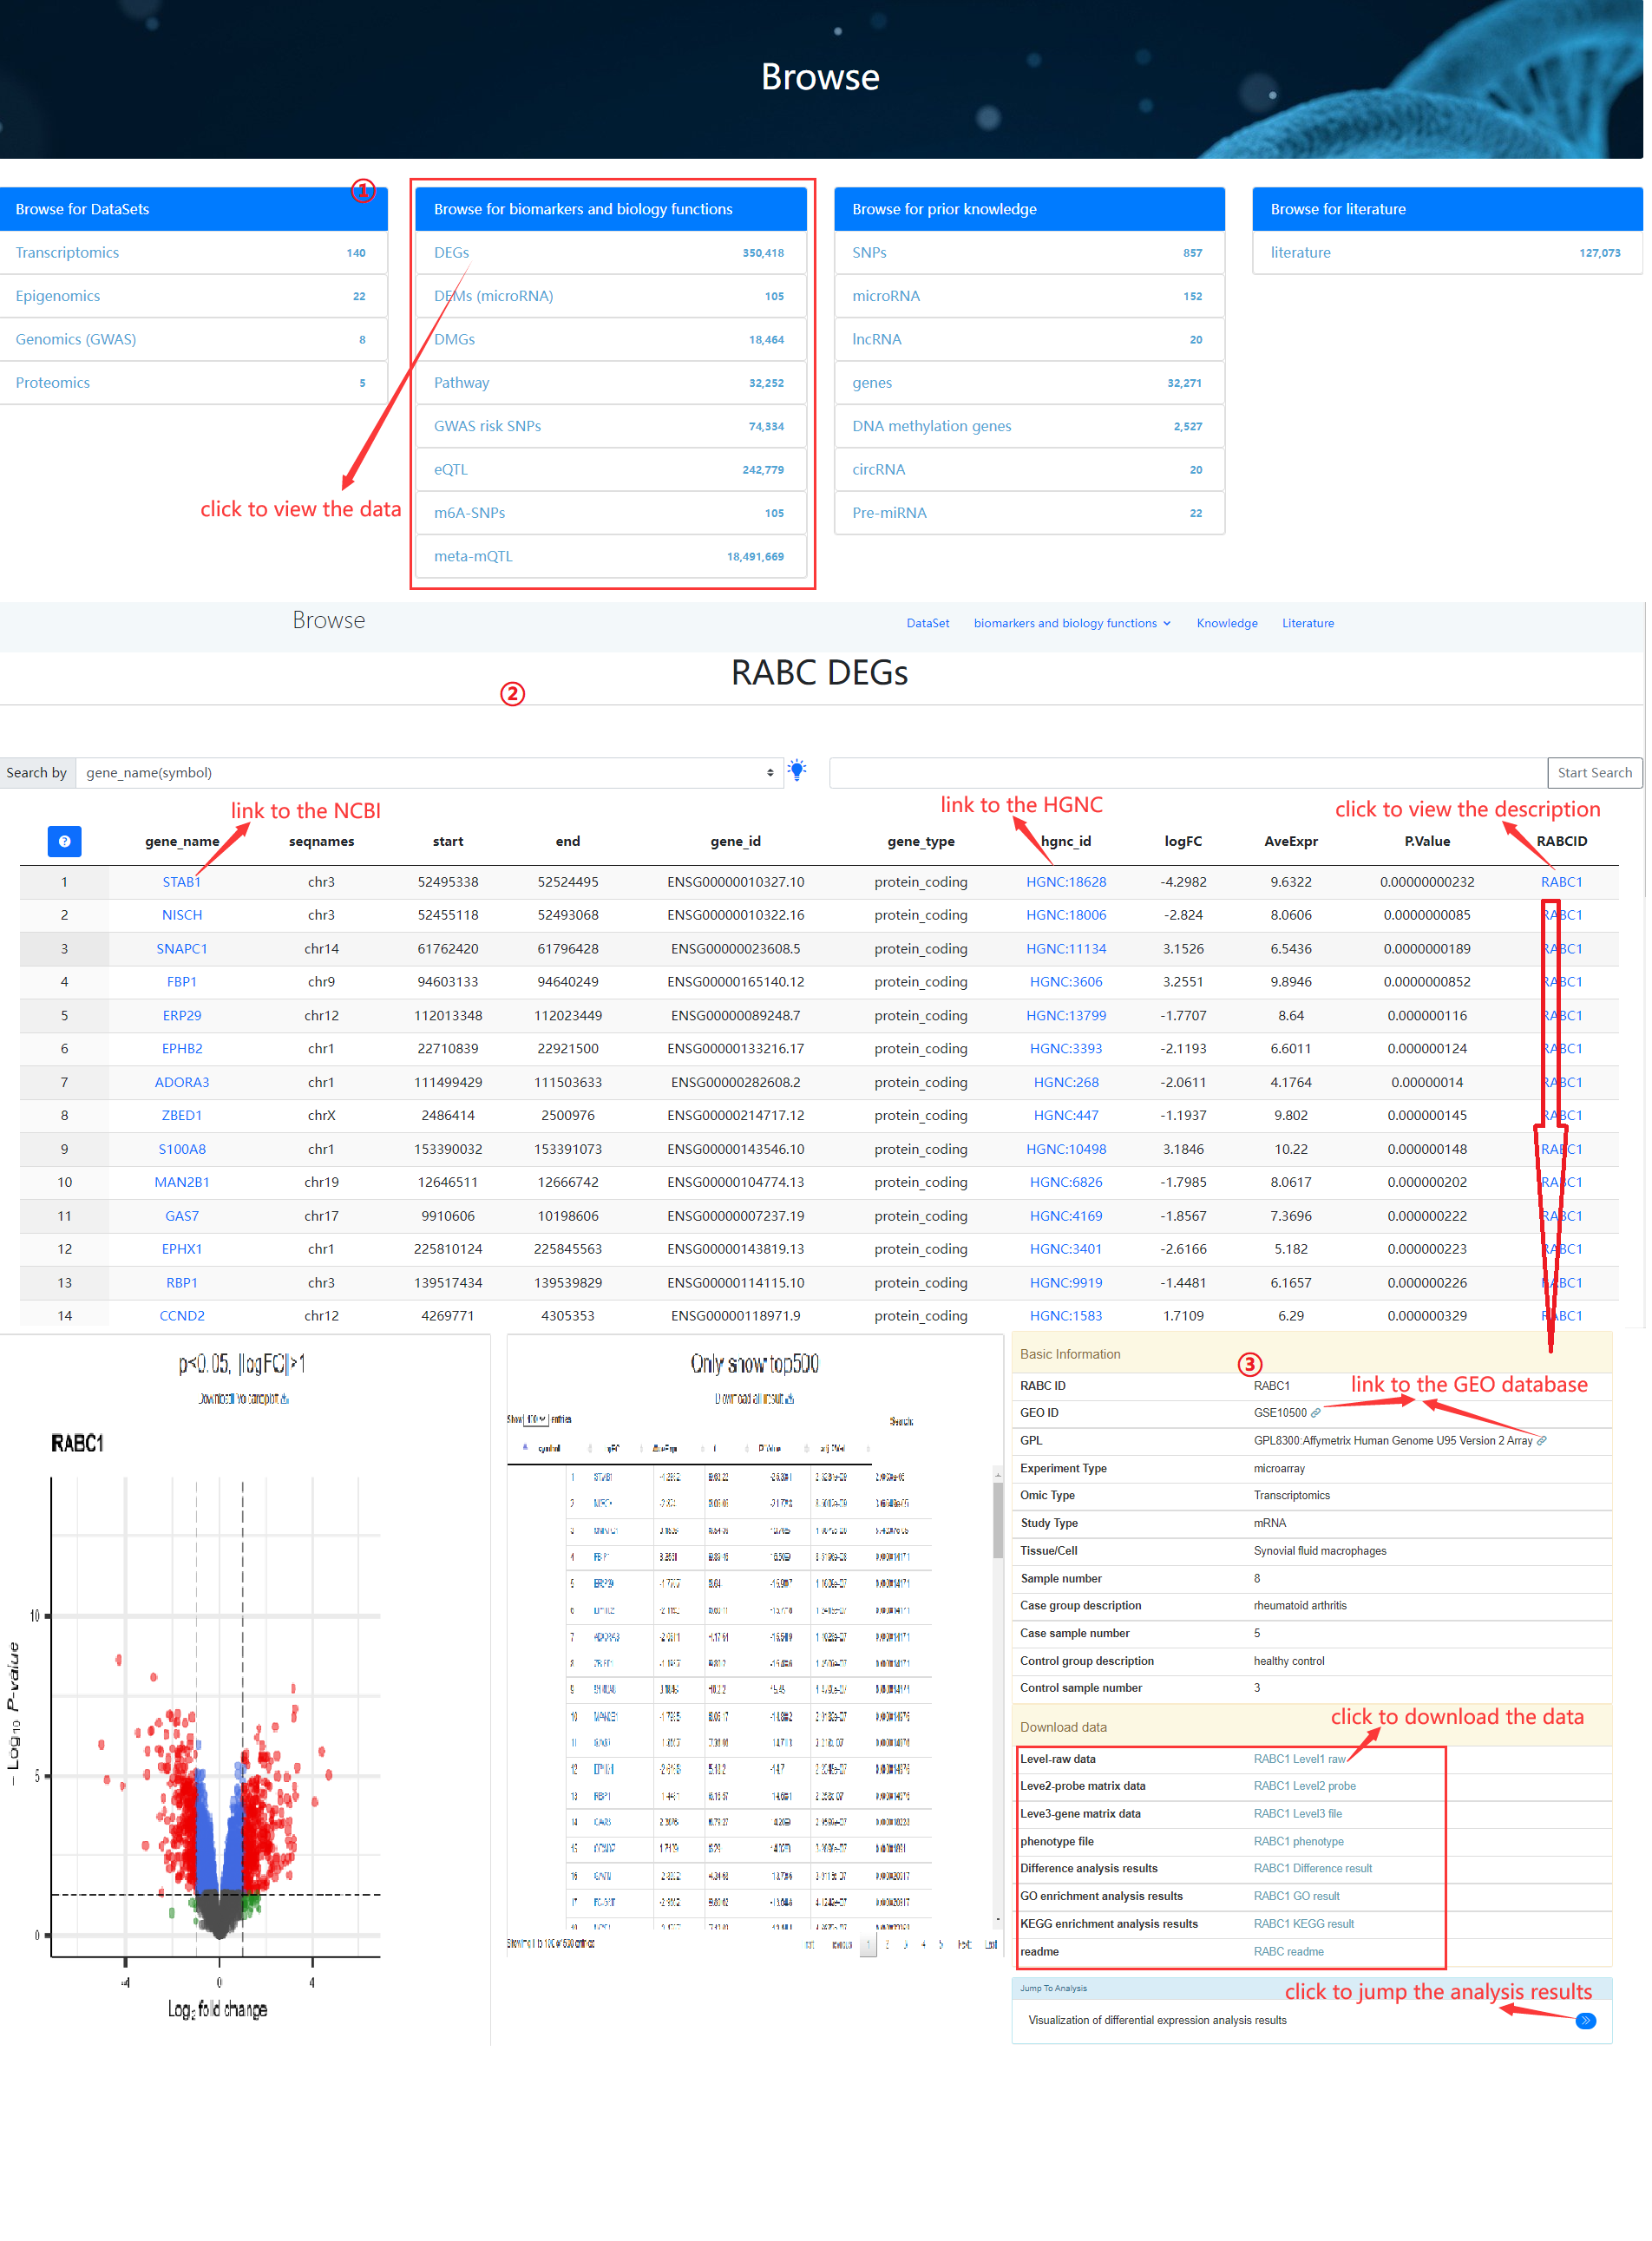
- The multi-omics data browsing interface. Users can view the description information of the data. The detailed information interface of each dataset provides not only a more detailed data description but also the raw data, preprocessed matrix data, and analysis results. Browse modules also support viewing the results of differential analysis and gene expression volcano plots for gene expression data.
- The biomarkers and biology functions browsing interface.
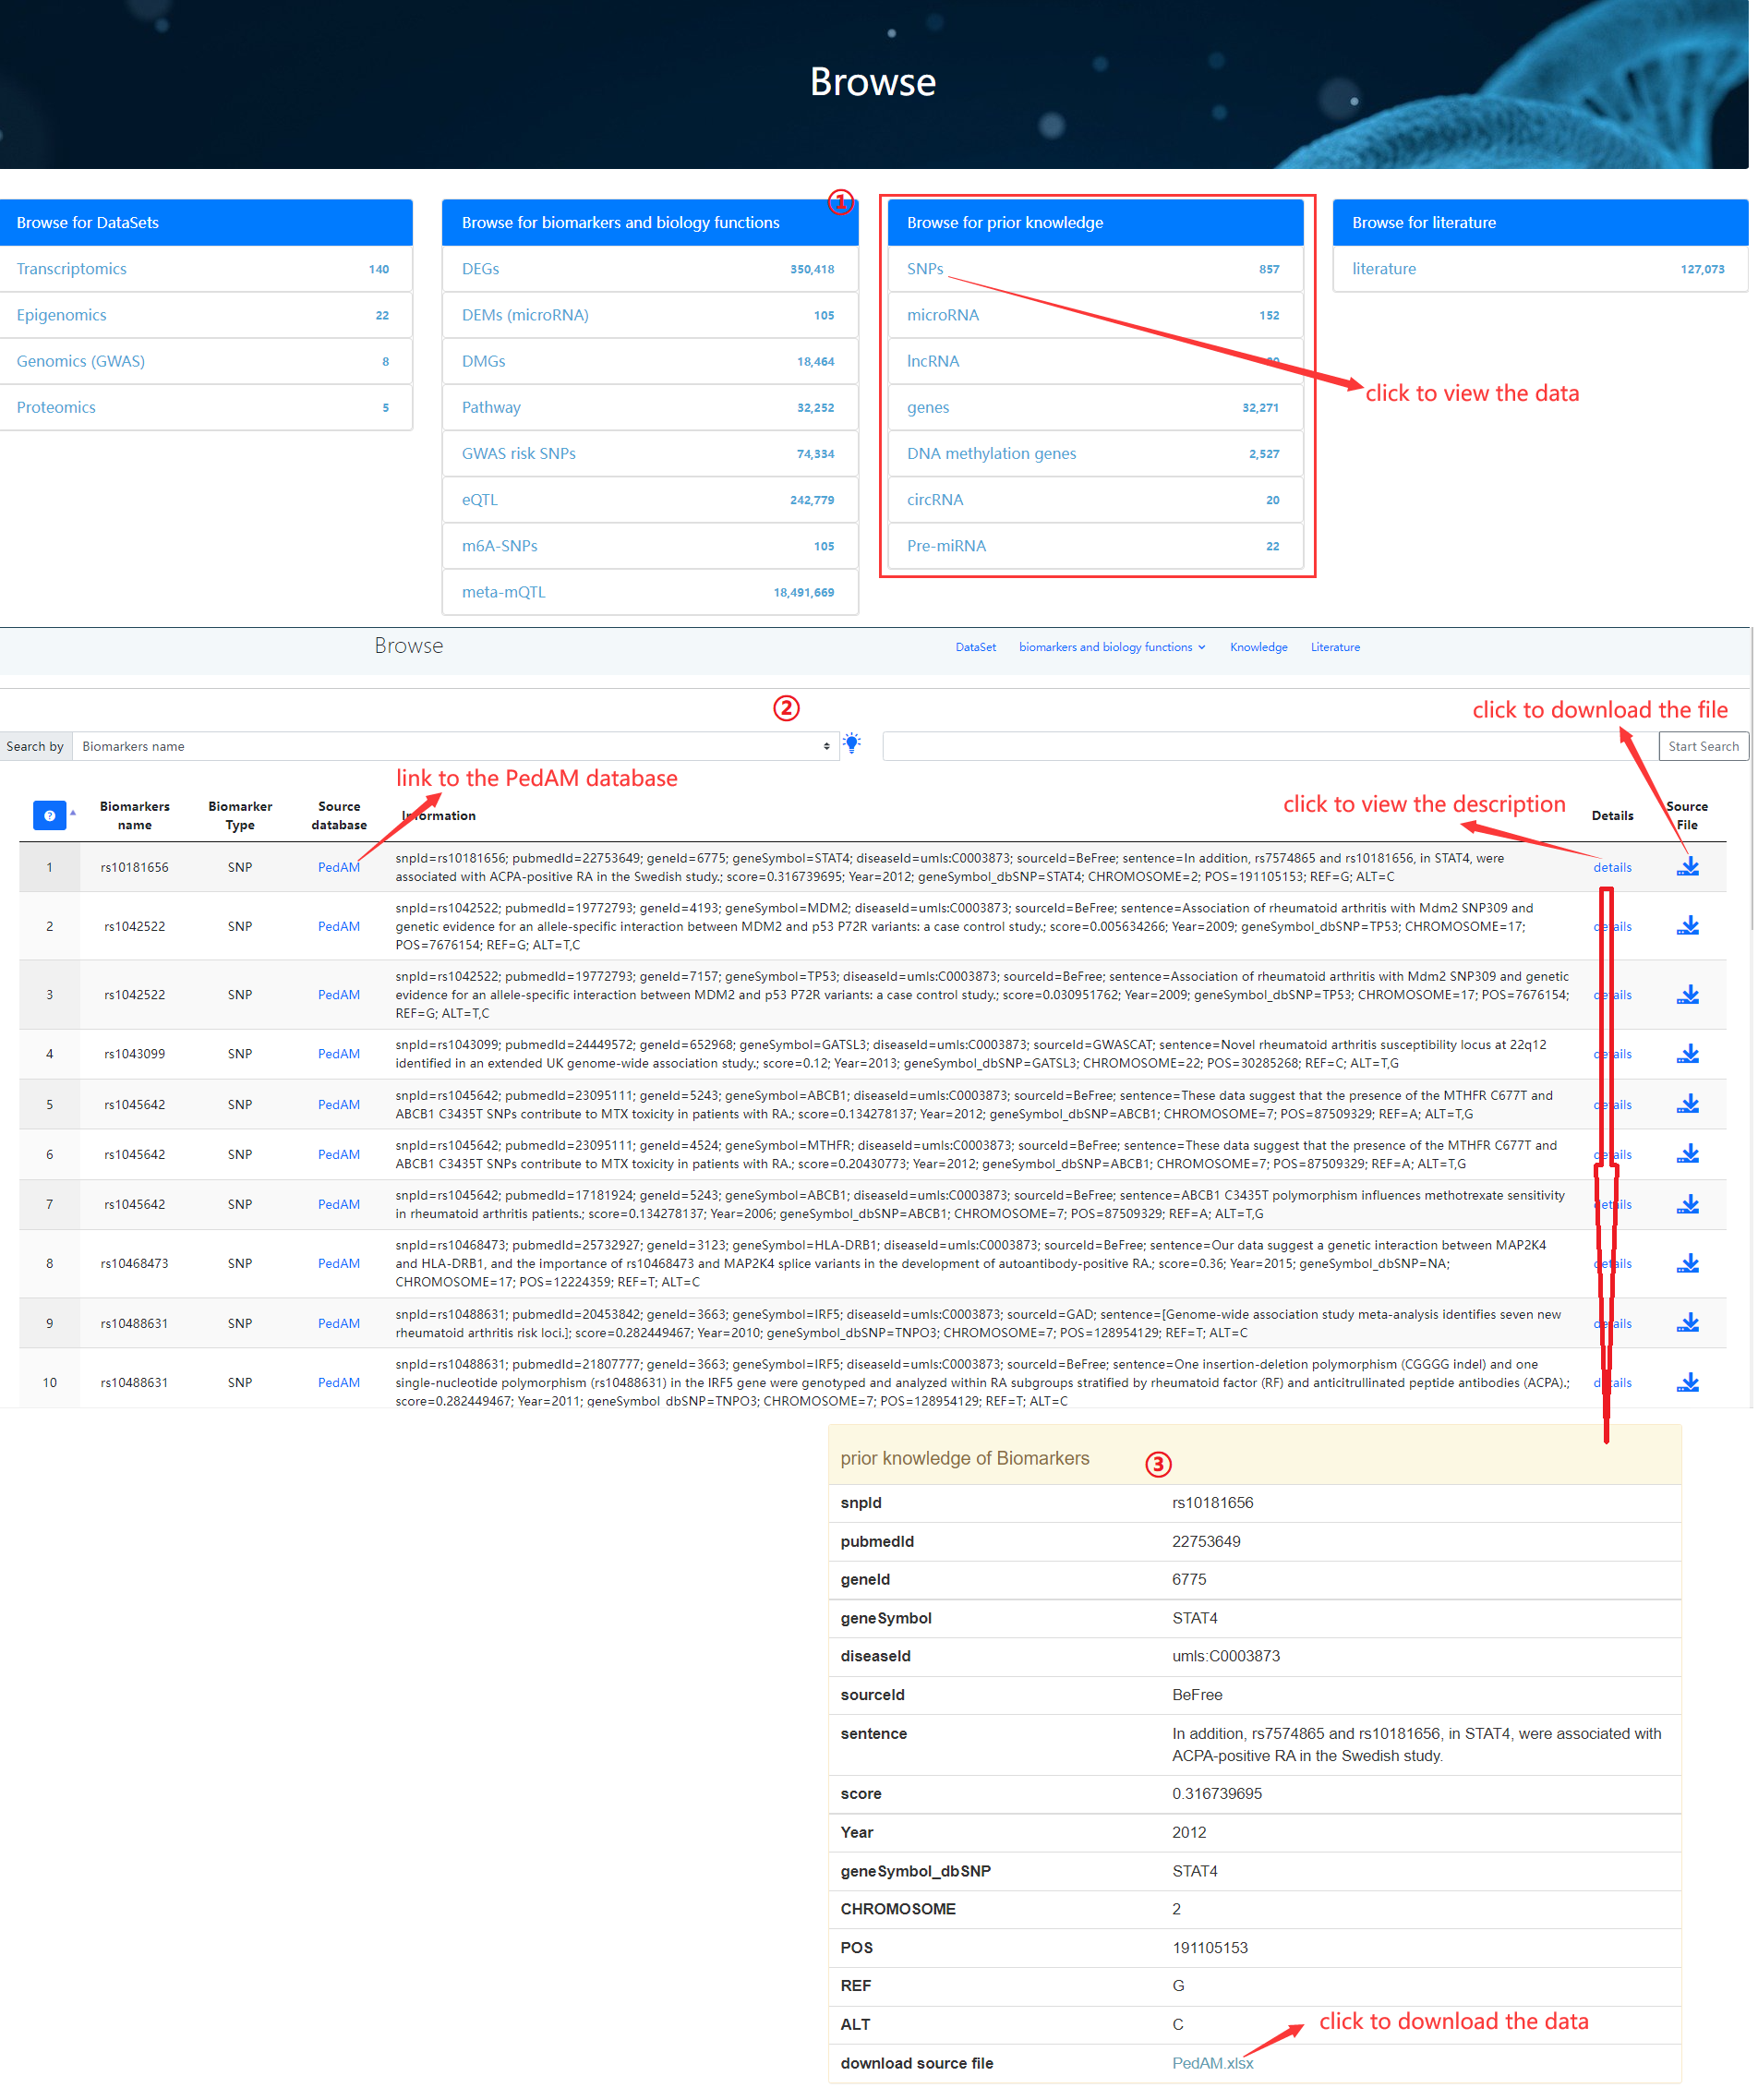
- The prior knowledge browsing interface.
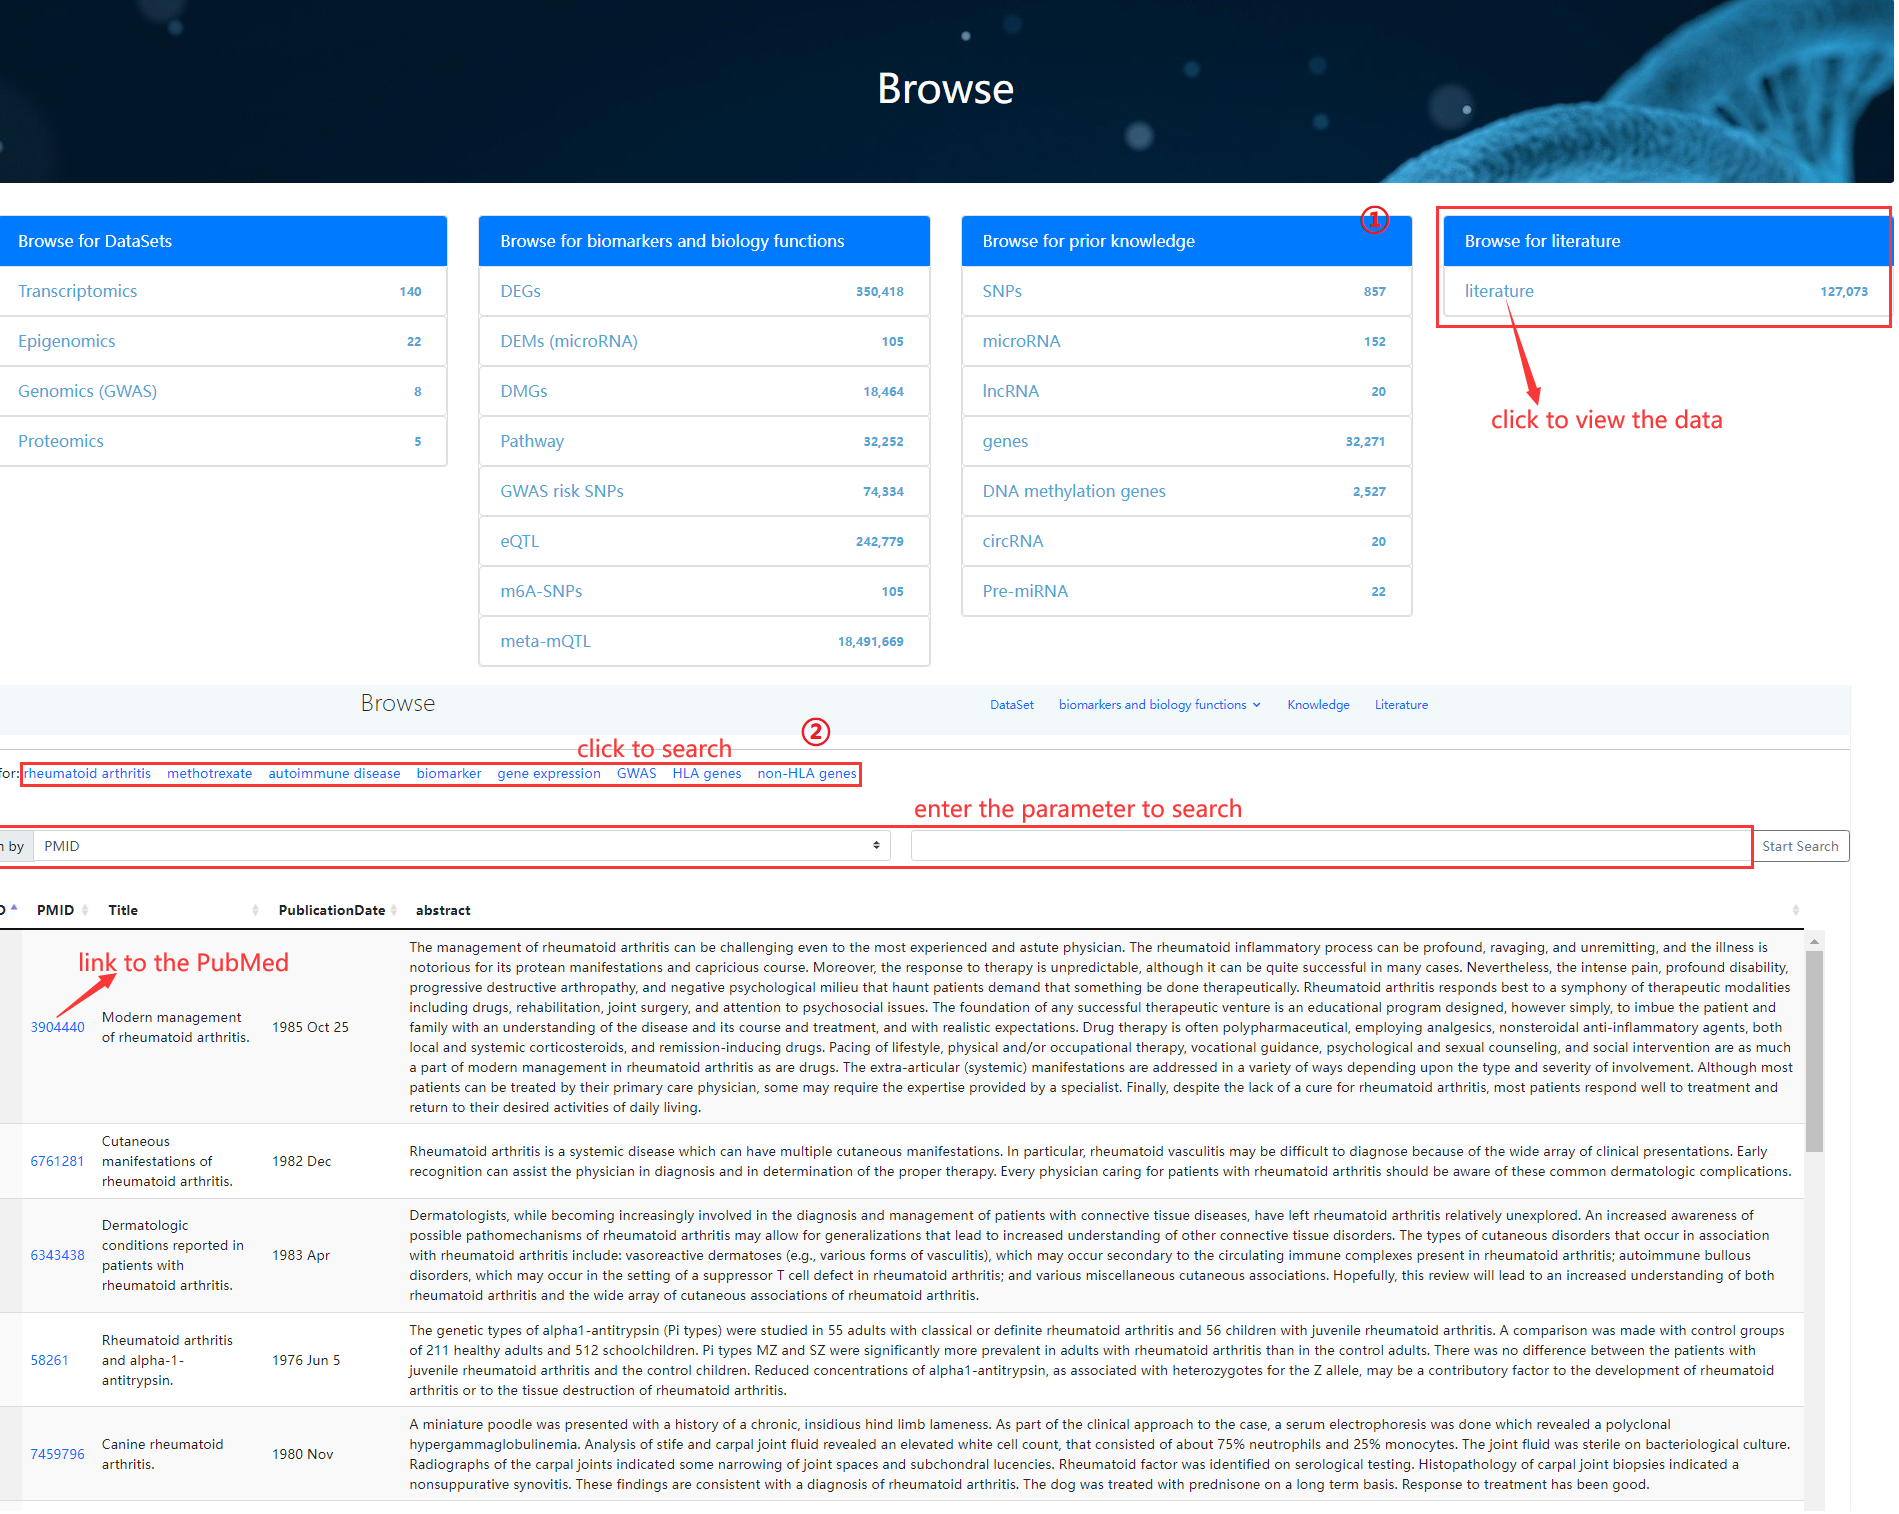
- The literatures browsing interface.
Search
- User can search the RABC by 4 methods: 1) datasets; 2) biomarkers and biology functions; 3) prior knowledge; 4) literature.

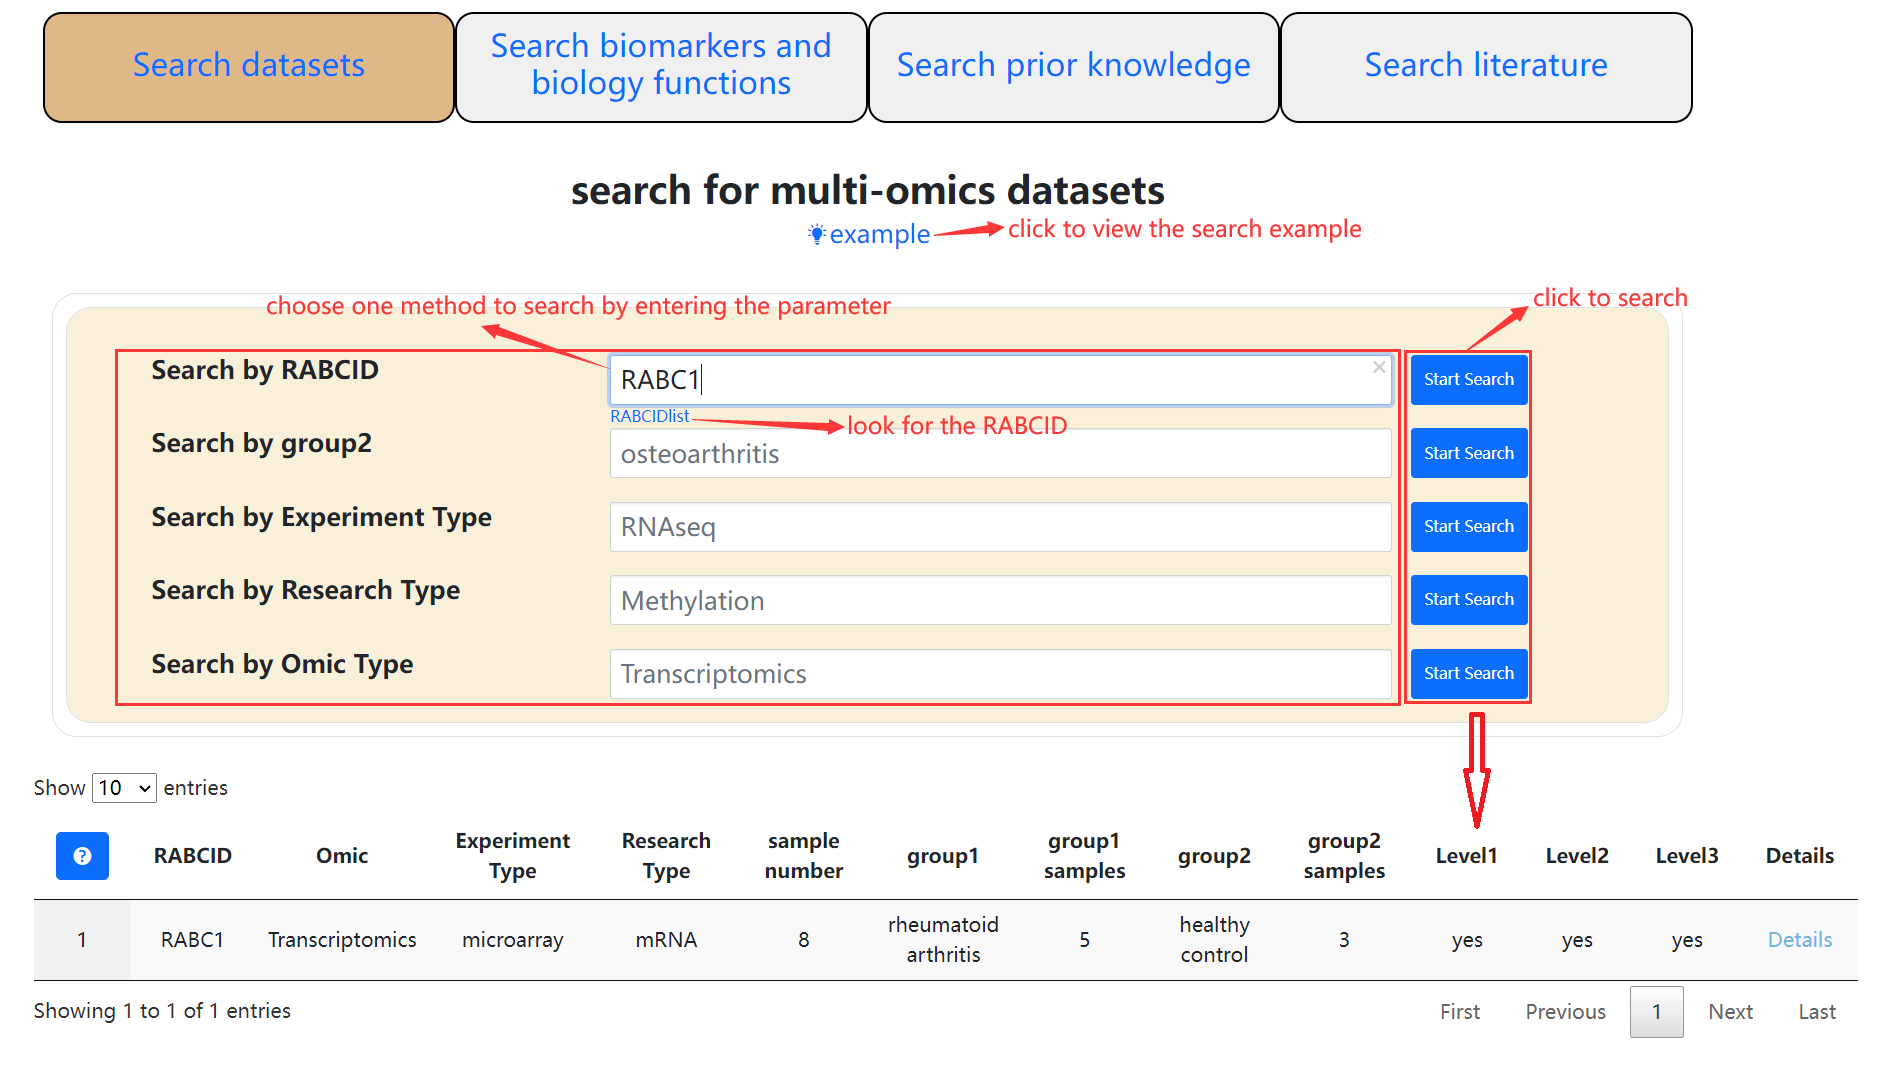
- Search for multi-omics datasets
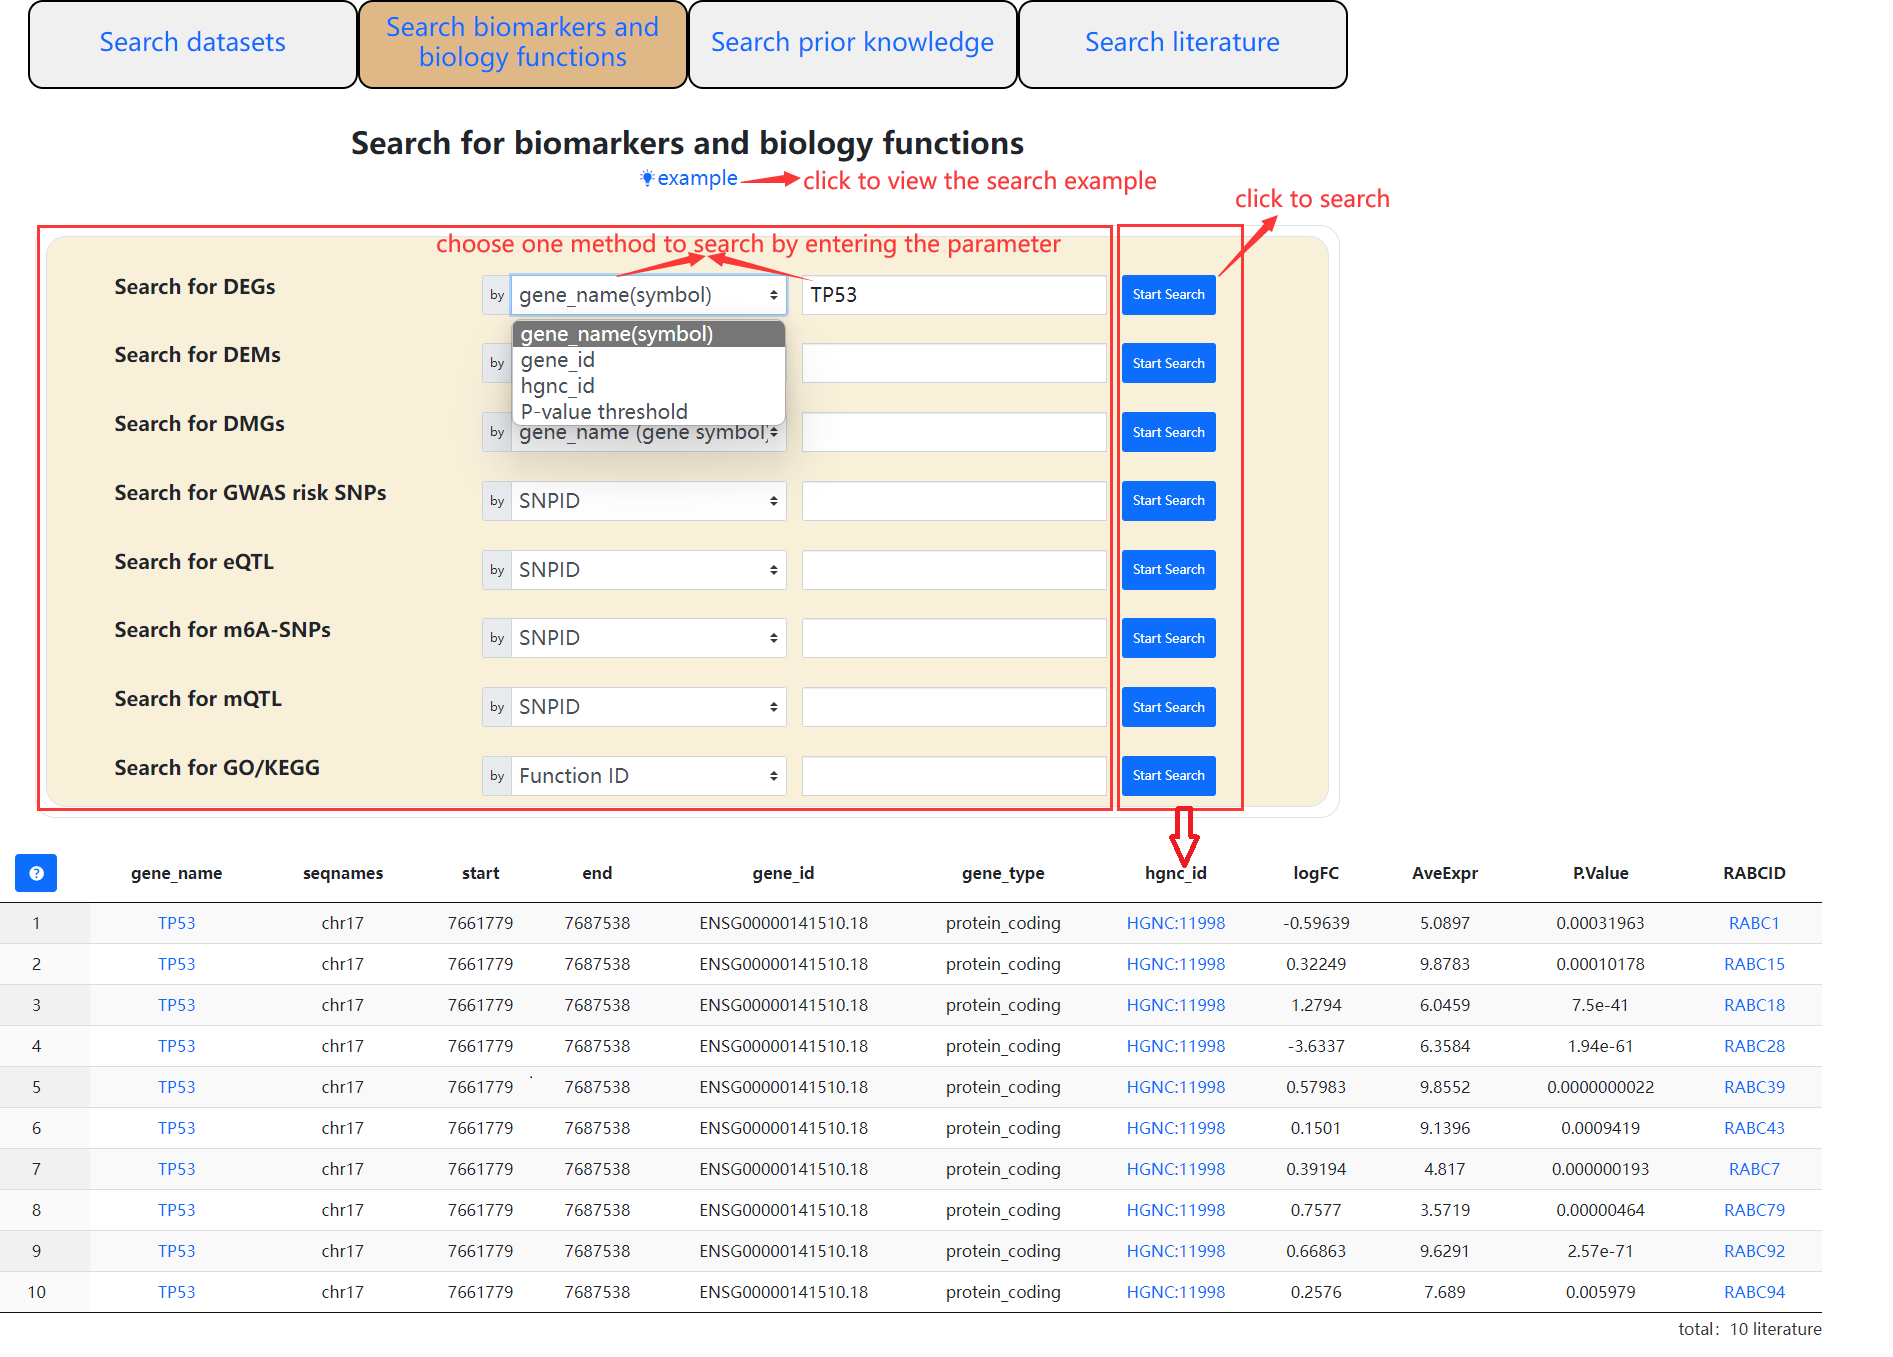
- Search for biomarkers and biology functions
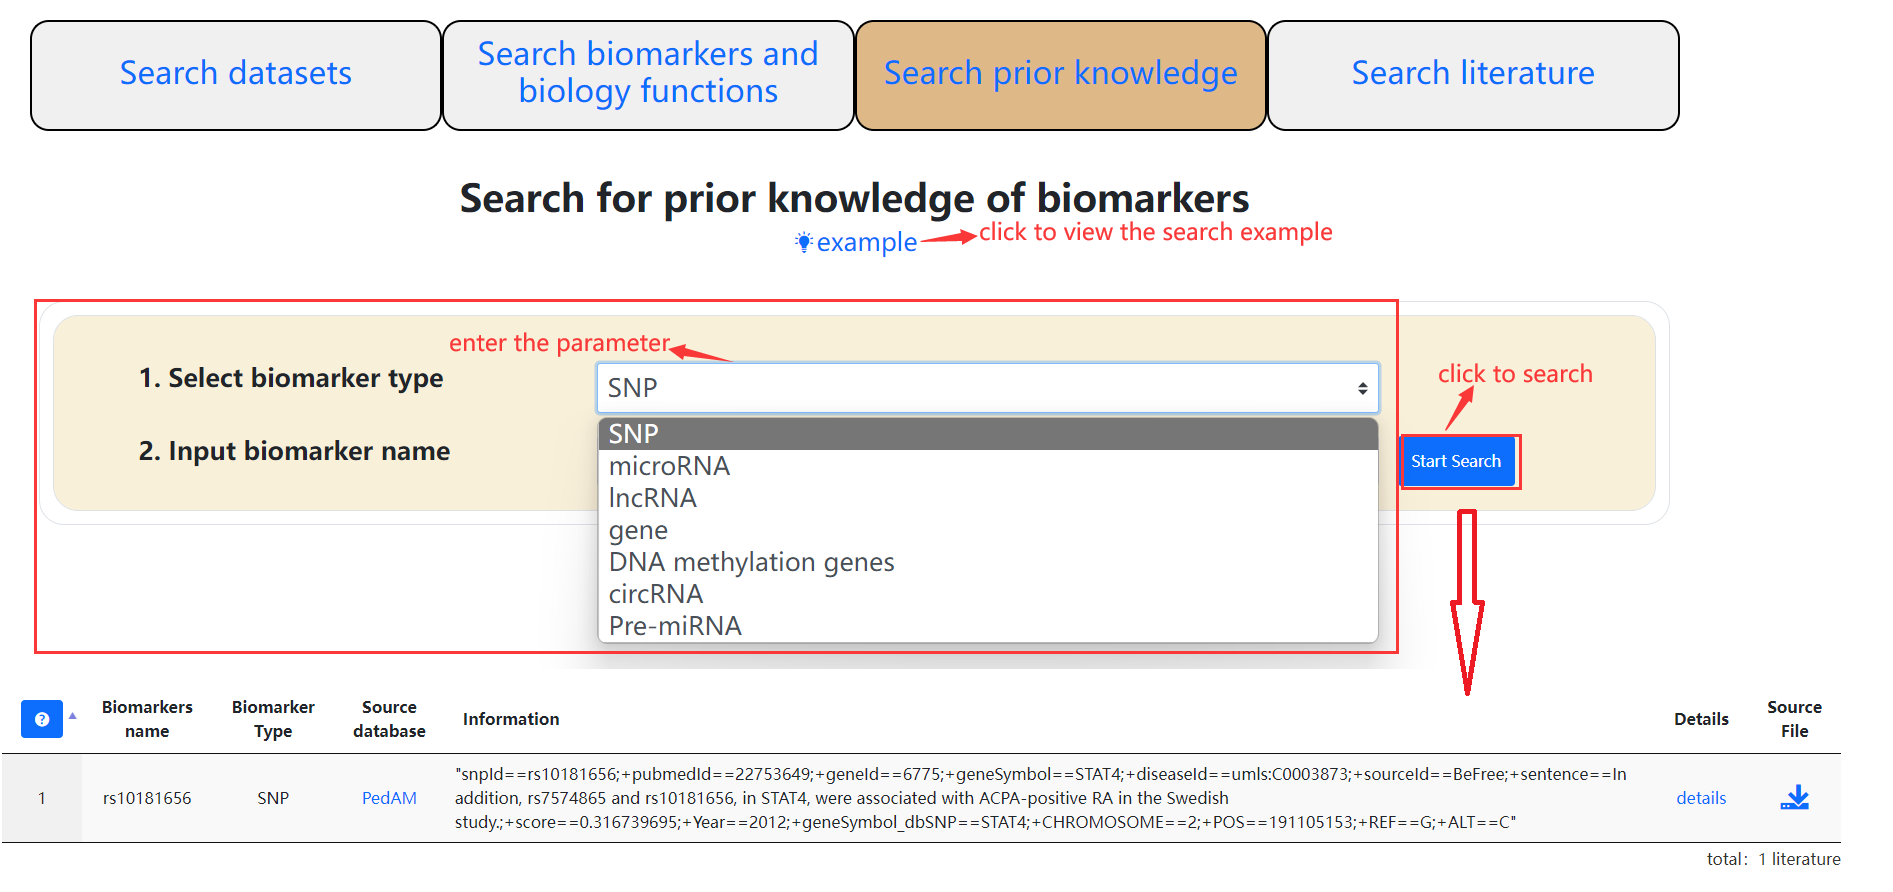
- Search for prior knowledge of biomarkers
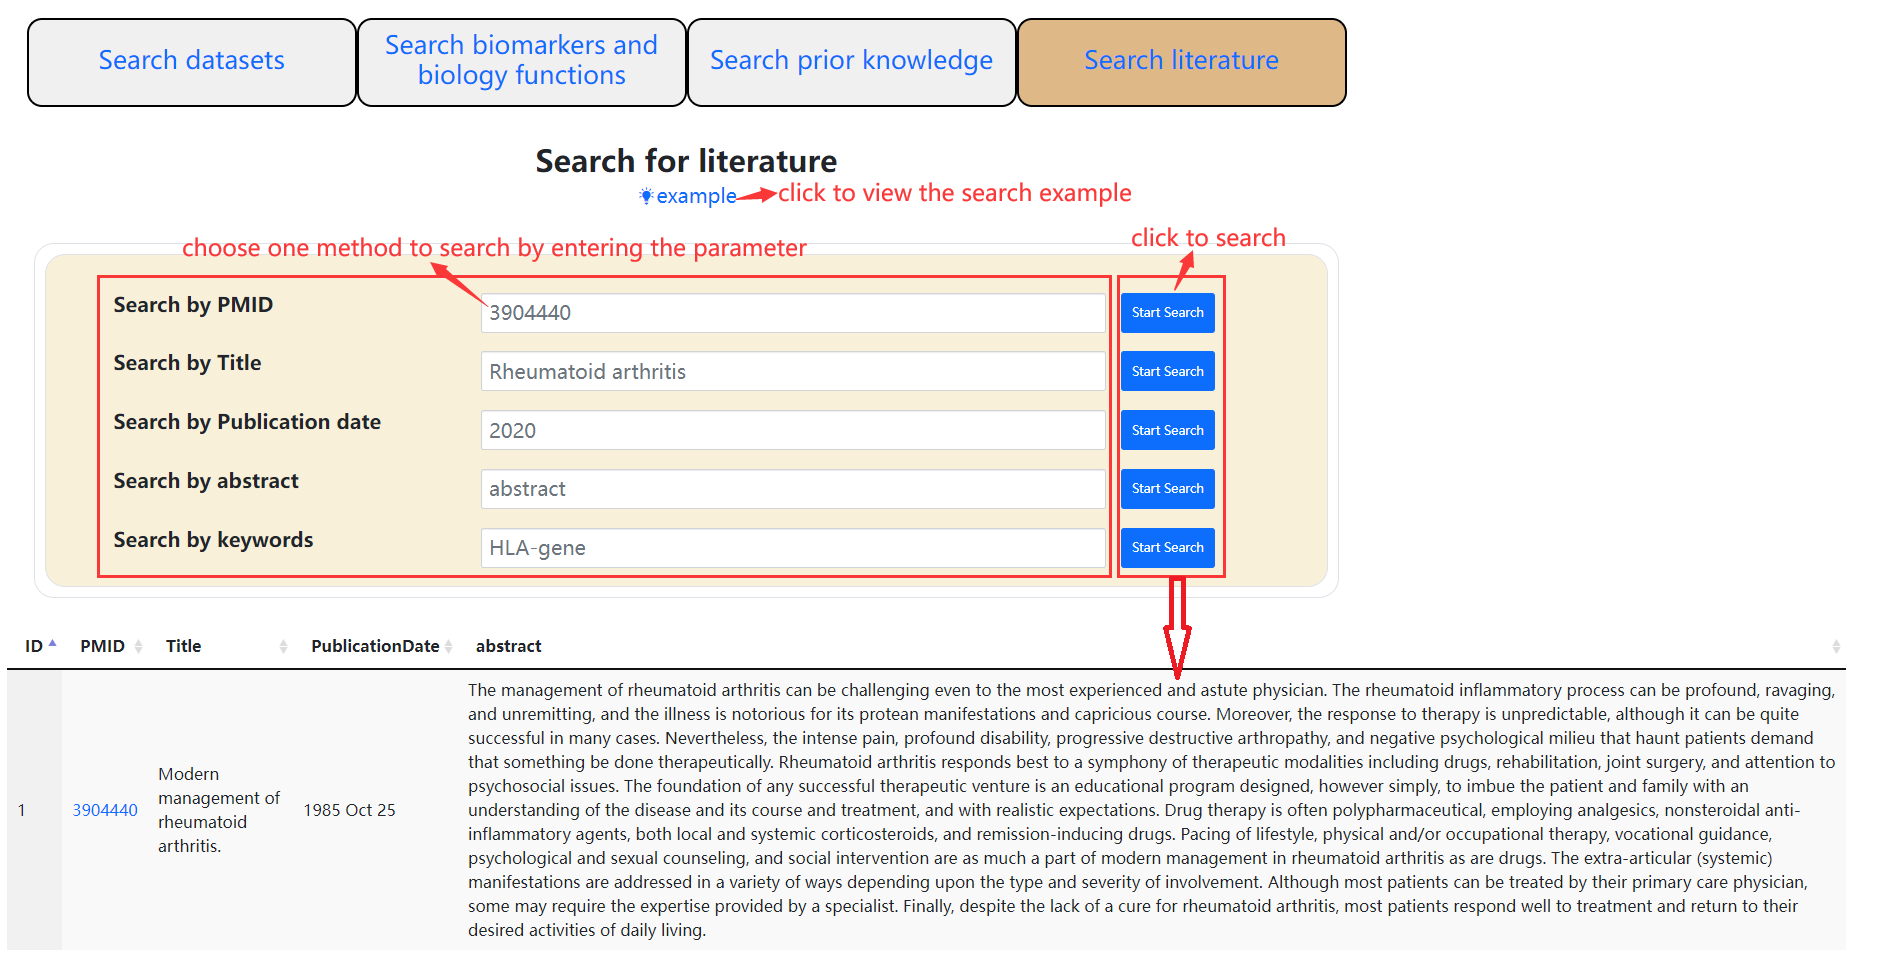
- Search for literature
Download
- In the download interface, we summarize the data information and analysis results, and users can directly access from this page.

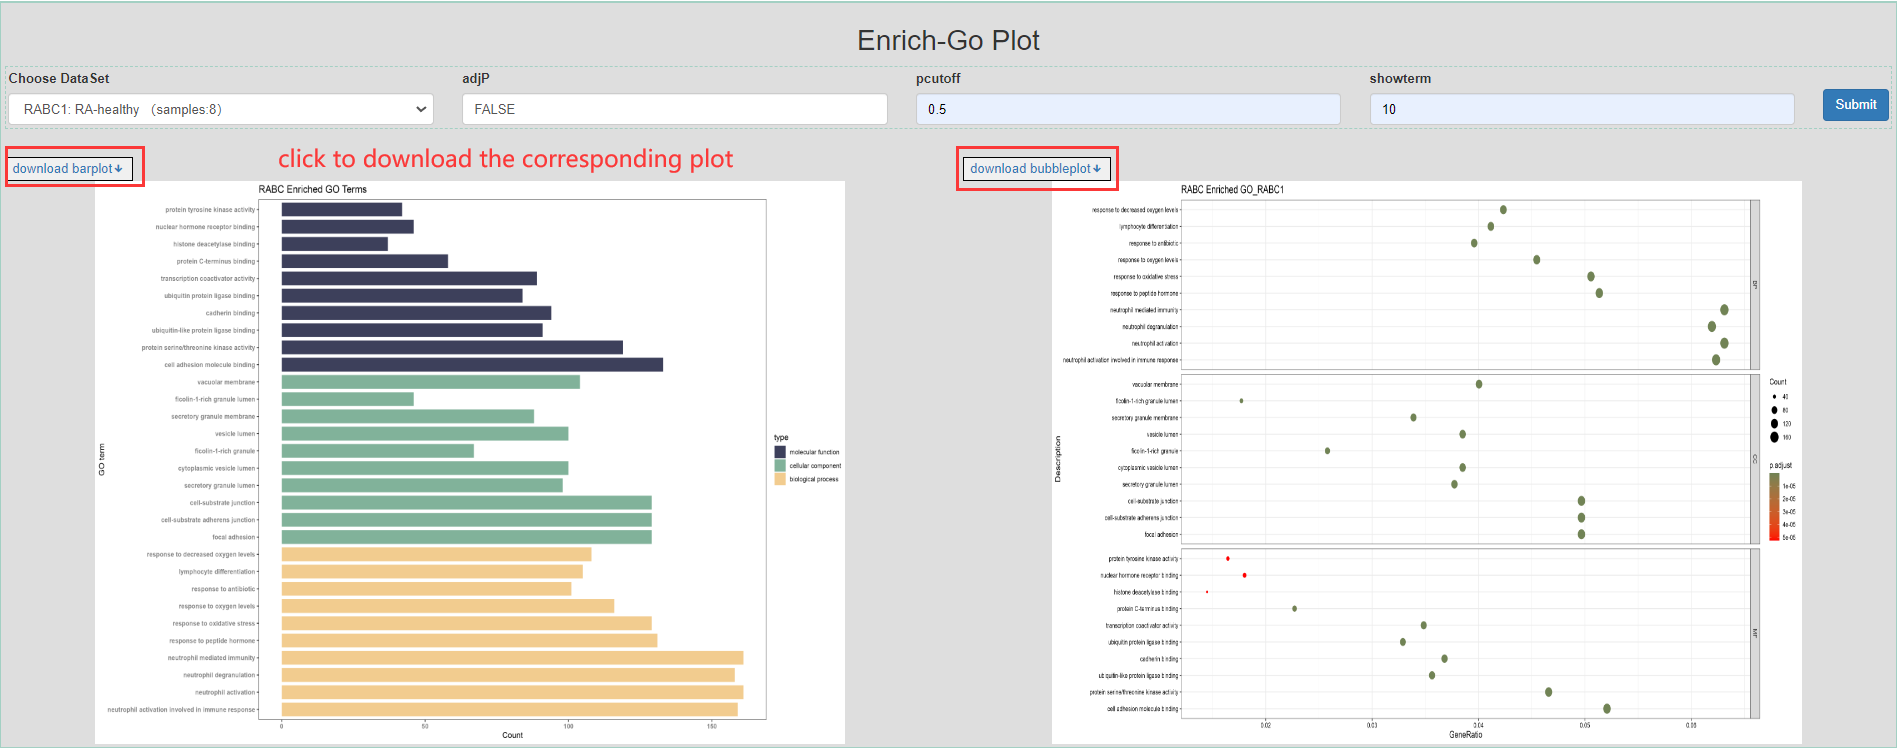
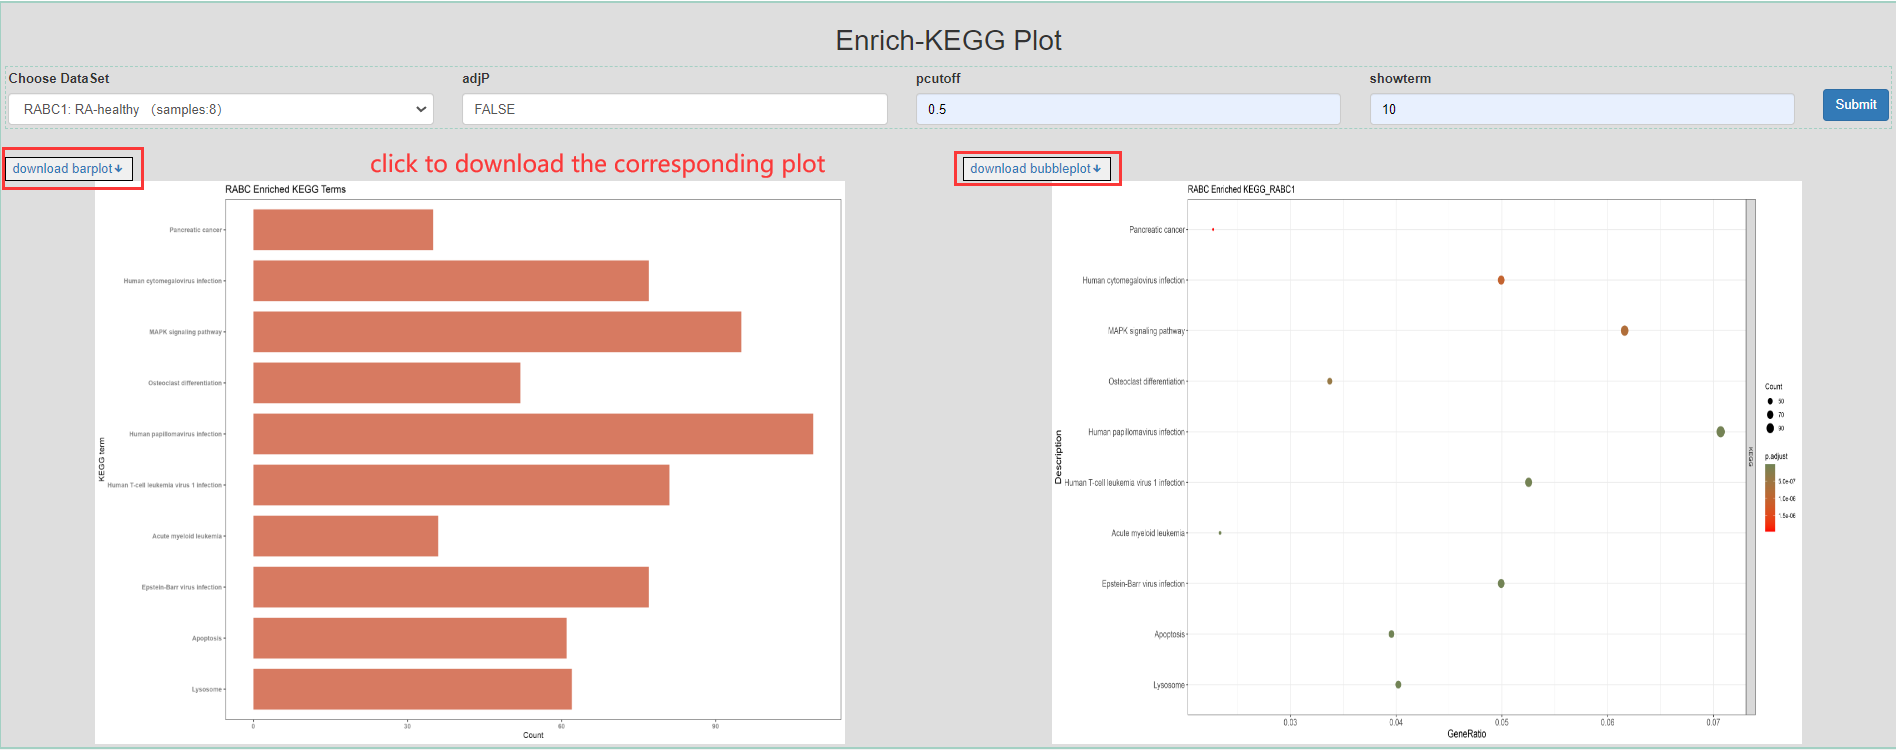
Visualization
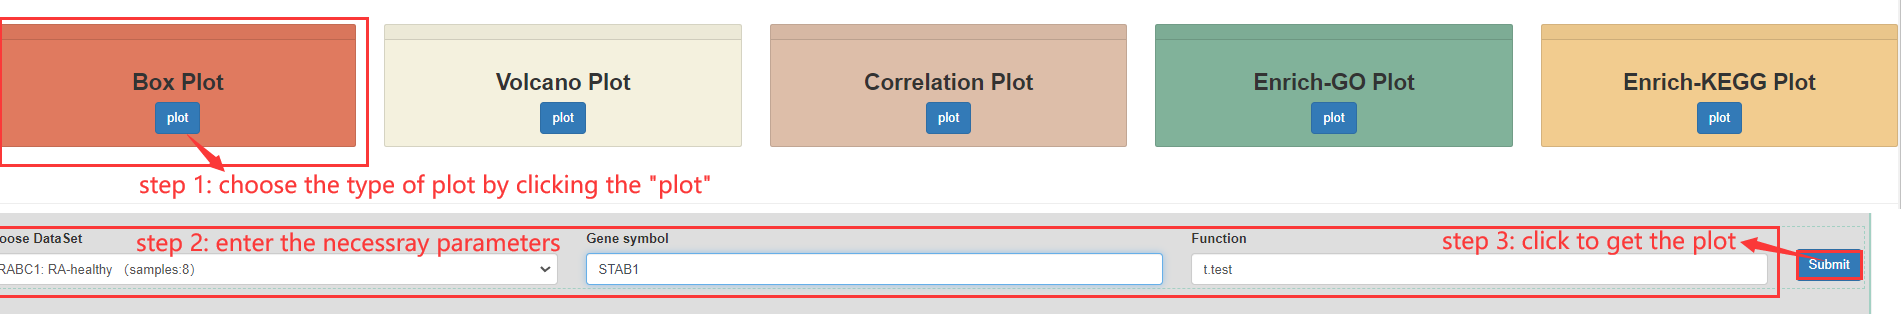
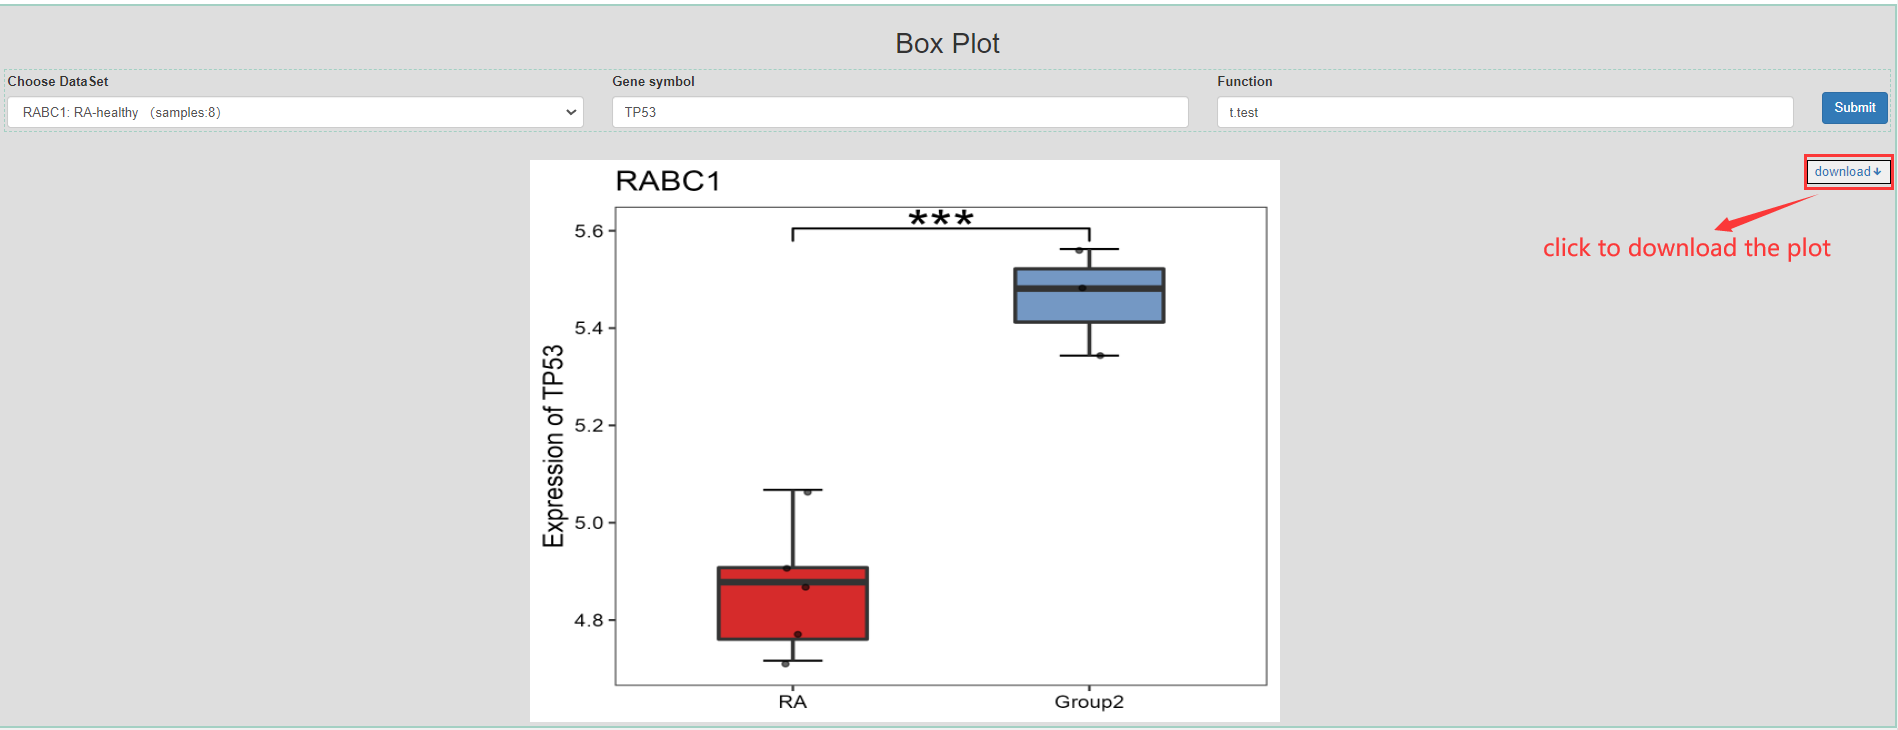
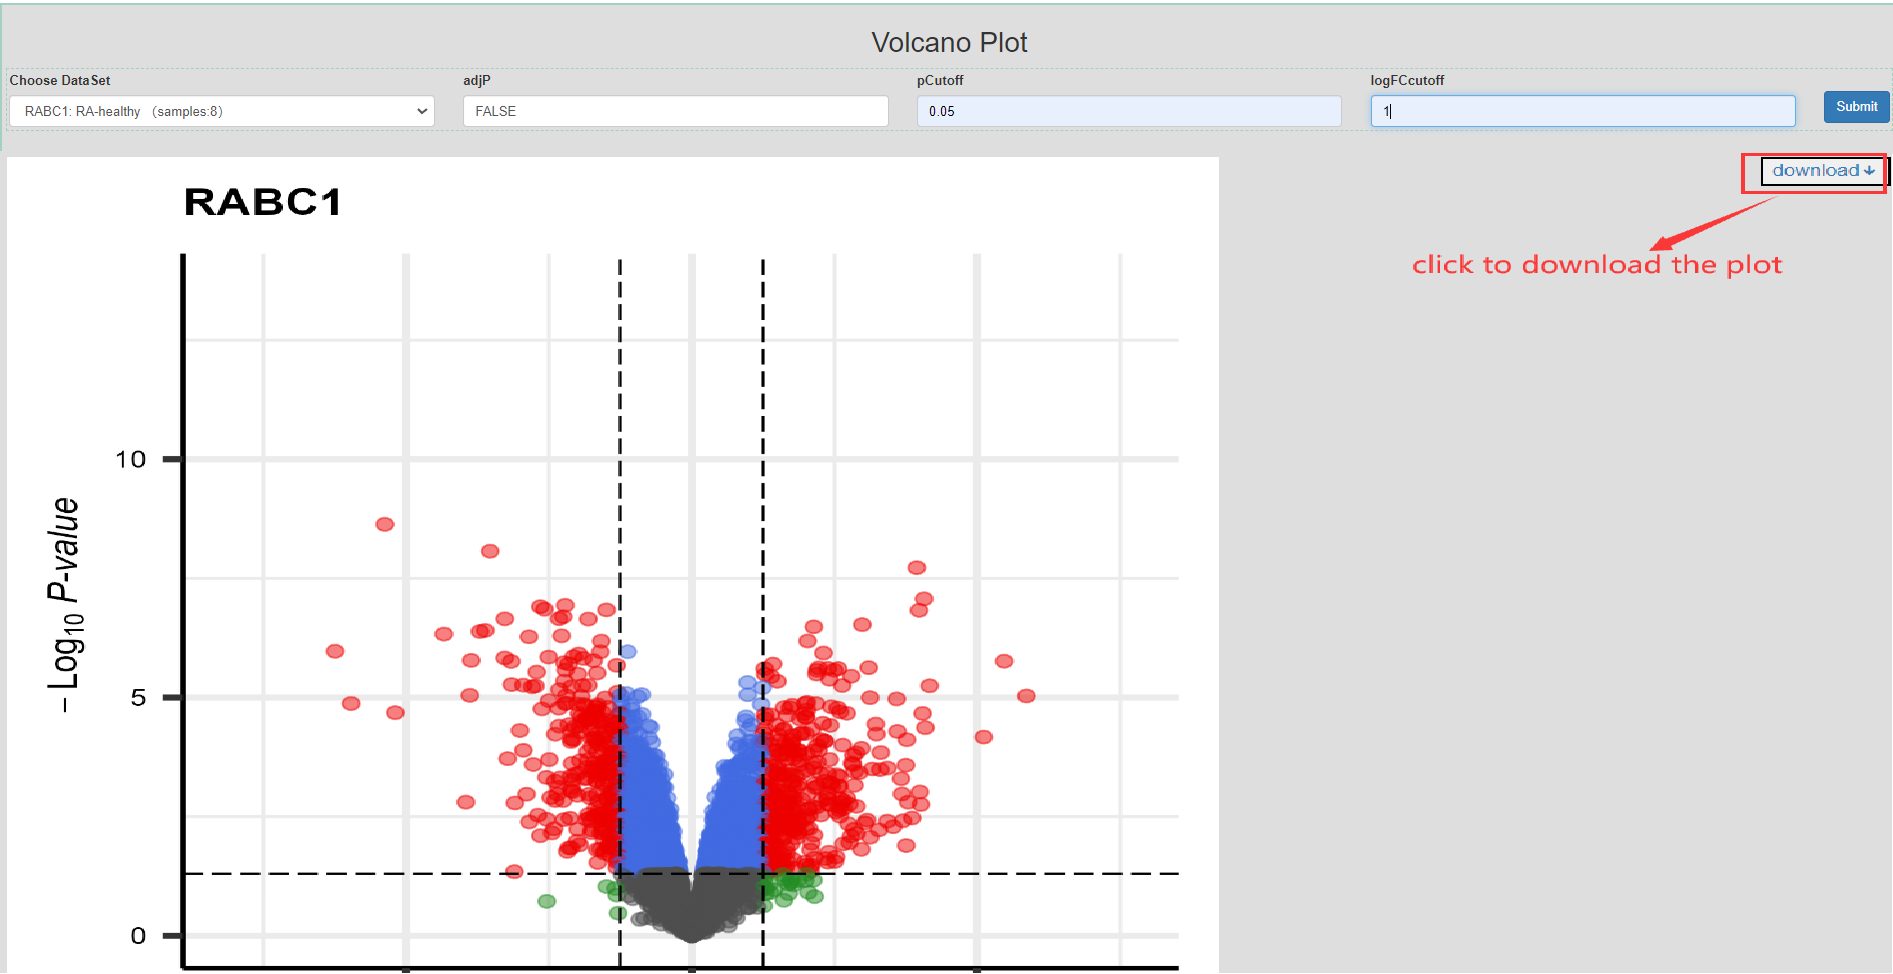
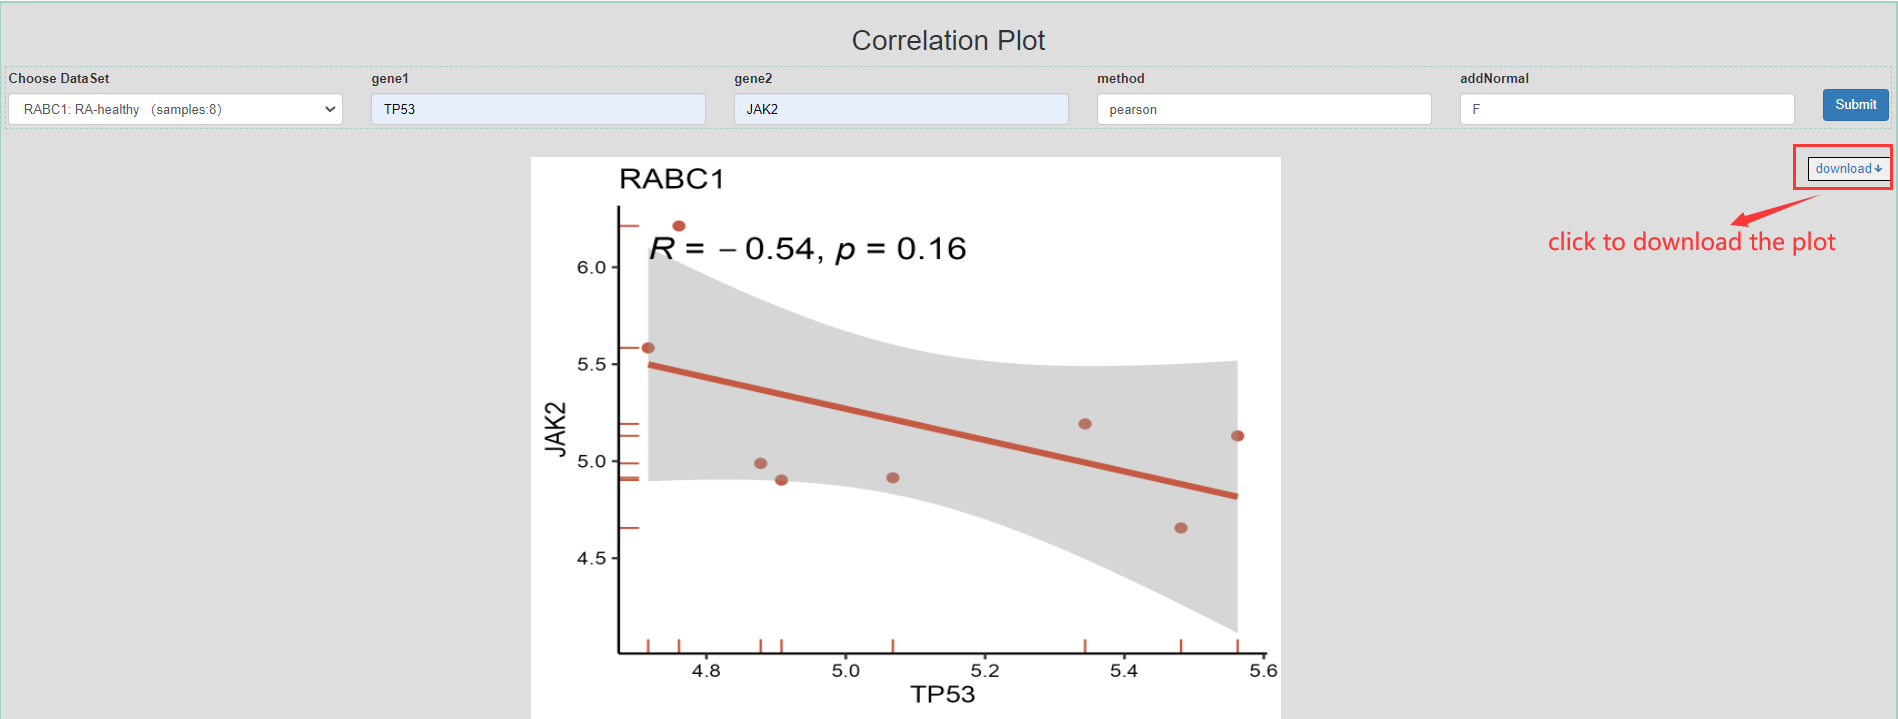
- The visualization module supports drawing boxplots, volcano plots, scatter plots, bar charts and bubble charts. Users can select the dataset and input the specified threshold or parameters, and then the corresponding graph can be drawn. These graphs also support downloading.
- Boxplots of gene expression
- Volcano plots of differential expression analysis
- Scatter plots of correlation between two genes
- Bar charts and bubble charts of functional enrichment analysis for gene expression profiling dataset